

Every serious system needs eyes on it: CPU, latency, error rates, business counters. “Design a monitoring system” (Datadog, Prometheus, CloudWatch) tests whether you understand a write-heavy, time-ordered workload — ingesting a firehose of numbers, storing them cheaply, and answering range queries and alert rules fast. It leans directly on the Time-Series Databases lesson, so have that model in mind.
Understanding the Problem
Functional Requirements
- Ingest metrics — Collect numeric measurements (metric name + tags + timestamp + value) from millions of hosts and services.
- Store — Keep the data queryable, with older data retained at lower resolution.
- Query — Answer range queries and aggregations (p99 latency for service X over the last hour, grouped by region).
- Dashboards — Render many such queries, refreshed continuously.
- Alert — Evaluate rules against incoming data and notify/page when thresholds are breached.
Non-Functional Requirements
| Requirement | Target |
|---|---|
| Write throughput | 10M+ data points/sec (write-dominated) |
| Ingestion latency | Seconds — fresh enough for alerting |
| Query latency (p99) | < 1s for dashboard range queries |
| Retention | Full resolution for days, downsampled for a year+ |
| Availability | Monitoring must stay up when the monitored system is sick |
| Durability | Some loss of individual points is tolerable; alerts must still fire |
Scale Estimation
- 1M hosts × 200 metrics each, reported every 10s → ~20M data points/sec.
- Each point is tiny (~16 bytes compressed: timestamp delta + value), but at 20M/sec that is ~320 MB/sec, ~28 TB/day before compression and downsampling.
- Columnar time-series compression (delta-of-delta timestamps, XOR-encoded floats) routinely hits 10x+, and rollups shrink old data further, so the stored footprint is far smaller than the raw stream.
The numbers tell you two things immediately: this is write-dominated (reads are a tiny fraction of writes), and a general-purpose database will not keep up — you need a time-series store and aggressive downsampling.
Core Entities and APIs
The core entity is a time series: a unique combination of a metric name and a set of tags, carrying an ordered stream of (timestamp, value) points.
Data Model
series key =  metric_name + sorted(tags)
   e.g.  http.request.latency{service=checkout, region=us-east, le=0.5}

Series  →  [(t0, v0), (t1, v1), (t2, v2), ...]   # append-only, time-ordered

DataPoint = {
    series_id:  int64     # interned hash of metric + tags
    timestamp:  int64     # ms
    value:      double
}

# Rules live separately
AlertRule = {
    id, query, condition (e.g. "> 0.5 for 5m"),
    severity, notify: [channels], dedup_key
}
The cardinality of a metric is the number of distinct series it produces — the product of its tag value counts. latency{service, region} with 50 services and 5 regions is 250 series. Add user_id as a tag and it explodes to millions. Cardinality is the single thing that blows up a metrics system, so we treat tag design as a first-class concern.
API Design
# Ingest (agents push, or the system scrapes an endpoint)
POST /ingest
  body: { points: [{ metric, tags, timestamp, value }, ...] }

# Query (dashboards and alert evaluation)
POST /query
  body: {
    metric: "http.request.latency",
    filters: { service: "checkout" },
    agg: "p99", group_by: ["region"],
    range: { from, to }, step: "1m"
  }
  response: { series: [{ tags, points: [[t, v], ...] }] }

# Alert rules
POST /alerts   body: { query, condition, severity, notify }
High-Level Design
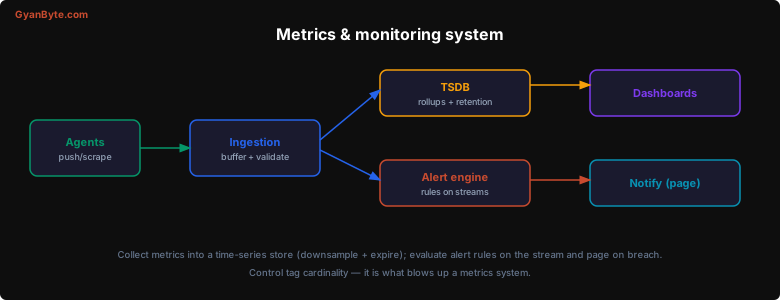
- Agents on each host collect metrics and either push them to the ingestion tier or expose an endpoint that the system scrapes (Prometheus’ pull model). Push scales to ephemeral workloads; pull makes “is this host up?” trivial.
- Ingestion tier is a stateless, horizontally scaled fleet that validates points, rejects high-cardinality offenders, batches, and writes to storage. A durable buffer (Kafka) in front absorbs spikes and decouples ingestion from storage.
- Time-series database stores points in columnar, time-partitioned blocks, continuously downsamples old data into rollups, and expires by retention policy.
- Alert engine periodically evaluates each rule’s query over recent data (or consumes the stream directly), and on breach emits an alert to the notification path.
- Query/dashboard tier serves range queries and aggregations from the store, hitting a cache for hot dashboard panels.
The clean split: the write path (agents → buffer → ingestion → TSDB) is tuned for throughput; the read path (dashboards, alert evaluation) is tuned for fast range scans. They meet only at the storage layer.
Deep Dive: Ingestion and Storage at Firehose Scale
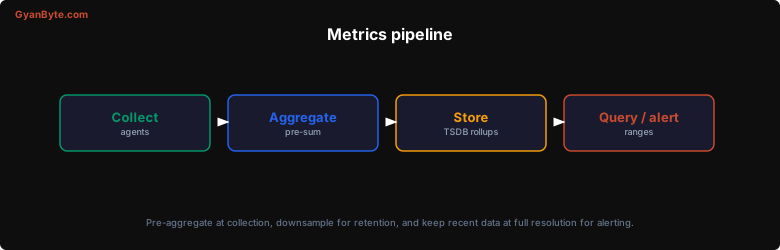
The write path has to swallow tens of millions of points per second without falling behind.
Pre-aggregate at the edge. Agents can locally pre-aggregate before sending — e.g. compute a histogram or a per-10s summary rather than shipping every raw sample. This cuts the point volume dramatically at the source. For request latency, agents emit histogram buckets (counts per latency range) so the backend can compute any percentile without storing every observation.
Buffer, then write in batches. A Kafka layer between ingestion and storage absorbs bursts and lets the TSDB write in large sequential batches (the write-buffering pattern). If storage is briefly slow, the buffer grows instead of dropping data.
Store columnar and time-partitioned. Points for a series are appended together and compressed hard — delta-of-delta encoding for the regularly spaced timestamps, XOR encoding for the slowly changing float values (the Gorilla compression scheme). Data is partitioned into time blocks (e.g. 2-hour chunks), so a query for “last hour” touches one or two blocks and old blocks can be dropped whole when they expire.
Downsample and expire. Nobody needs per-second resolution for data from six months ago. A background job rolls recent full-resolution data into coarser rollups (1-minute, then 1-hour averages/min/max) and deletes the raw data past its retention. This is what keeps a year of history affordable.
Control cardinality — the #1 failure mode. Every unique tag combination is a separate series with its own index entry and memory overhead. A single accidental high-cardinality tag (a user_id, a request_id, a raw URL with IDs in it) can create millions of series and OOM the ingesters. Defenses: reject or drop series above a per-metric cardinality limit, strip known-bad labels at ingestion, and surface cardinality as a metric itself so you catch an explosion early. In the interview, naming cardinality as the thing that breaks a metrics system is a strong signal.
Deep Dive: Alerting
An alert rule is a query plus a condition plus a notification target — “p99 checkout latency > 500ms for 5 minutes → page on-call.”
Evaluation. The alert engine runs each rule on a schedule (e.g. every 15–60s), querying the store (or a streaming aggregate) over the rule’s window. For low-latency alerting on high-volume signals, evaluate against a streaming aggregation (Flink/Kafka Streams) rather than polling the TSDB, so you alert in seconds, not after a slow range scan. A rule has state — “pending” once the condition is first met, “firing” after it holds for the full for duration — to avoid paging on a single transient spike.
Dedup and grouping. When a shared dependency fails, hundreds of rules fire at once. The notification path must group related alerts (by service/cluster/dedup key) into one incident and deduplicate repeats, or you drown the on-call in pages. This is a direct application of the Notification System design — idempotency keys, rate limiting, and routing.
Notify. Breaches route to the right channel (page via PagerDuty for sev-1, Slack for warnings), with escalation if unacknowledged. Alerting must be more available than the thing it watches, so run the alert path on independent infrastructure — if it lives inside the system being monitored, it dies exactly when you need it.
Deep Dive: Query and Dashboards
Dashboards issue many range-plus-aggregation queries that refresh continuously, so reads must be cheap.
- Range scans over compressed blocks. Because data is time-partitioned and columnar, “p99 over the last hour grouped by region” scans a couple of recent blocks per series and aggregates — no full-table work.
- Serve from rollups. A query spanning a month should read 1-hour rollups, not raw points; the engine picks the coarsest resolution that satisfies the requested step.
- Cache hot panels. Dashboard queries are highly repetitive (the same panels, every 30s). Cache recent query results with a short TTL so a hundred viewers of the same dashboard cost one query.
- Pre-aggregate recording rules. Expensive, frequently used queries can be materialized continuously into a new derived series (Prometheus “recording rules”), turning a heavy query into a cheap lookup.
Key Takeaways
| Decision | Choice | Why |
|---|---|---|
| Workload shape | Write-dominated, time-ordered | Design for ingest first; reads are a fraction of writes |
| Storage | Time-series DB, columnar + time-partitioned | Hard compression and cheap range scans; drop old blocks whole |
| Keep history affordable | Downsample into rollups + retention TTL | Full resolution recently, coarse forever |
| Ingestion | Buffer (Kafka) + batched writes + edge pre-agg | Absorb spikes, write sequentially, cut volume at the source |
| Biggest risk | Tag cardinality | Every tag combo is a series; cap and reject high-cardinality labels |
| Alerting | Rule state + dedup/grouping + independent infra | Page on sustained breaches, not spikes; survive the outage you’re watching |
| Query | Rollup selection + result cache + recording rules | Keep repetitive dashboard queries cheap |
“Design a metrics system” is really “design a write-optimized time-series pipeline with alerting on top.” Lead with the write path and the TSDB, name tag cardinality as the failure mode, and keep the alerting path independent of the system it monitors. Interviewers reward candidates who treat the firehose and the cardinality problem as the heart of the design rather than drawing a generic database.