Observability & Production Debugging — From the Three Pillars to Debugging a Live Incident
A practical course on seeing into production systems and debugging them fast: monitoring vs observability, the three pillars (logs, metrics, traces) and how they work together, structured logging, metric types with RED/USE and the four golden signals, distributed tracing and the trace waterfall, OpenTelemetry, dashboards that aren't noise, alerting without fatigue, SLOs and error budgets, a repeatable incident-debugging workflow, performance debugging (percentiles, tail amplification, flame graphs), and the cost/cardinality engineering that keeps the observability bill sane. Grounded in real measurements.


Every engineer eventually faces the same 2 AM moment: something is wrong in production, users are affected, and you have no idea why. The difference between the teams who resolve it in minutes and the teams who flail for hours is observability — whether their systems were built to be understood, and whether they know how to read what the systems are telling them. This course is about both: instrumenting systems so you can see inside them, and the craft of using what you see to find and fix problems fast.
We start from the distinction that matters — monitoring (watching for failures you anticipated) versus observability (being able to ask questions you didn’t anticipate) — and build up through the three pillars: logs (what happened), metrics (how much/how fast), and traces (where the time went), and crucially how they work together. We cover each in depth — structured logging, metric types with the RED/USE methods and the four golden signals, distributed tracing and the trace waterfall — then OpenTelemetry, the standard that ties it all together, dashboards that answer questions instead of adding noise, and alerting that pages a human only when a human must act.
Then the operational heart: SLOs and error budgets (defining “reliable enough” as a number), a repeatable incident-debugging workflow (detect → triage → stabilise → localise → root-cause → learn), performance debugging (why the average latency lies, tail amplification, flame graphs), and finally the cost and cardinality engineering that stops your telemetry bill from exceeding the service it watches.
It’s written in plain Indian English and grounded in real measurements I ran — a latency distribution showing how the mean hides a p99 that’s 10× worse, the maths of tail amplification (at 100 dependencies, ~63% of requests hit a “rare” slow one), a cardinality explosion from 6,000 series to 6 billion with one bad label, and a trace waterfall that pins a 520 ms request on an external call two services deep. Every lesson ends with pitfalls and a quick recap.
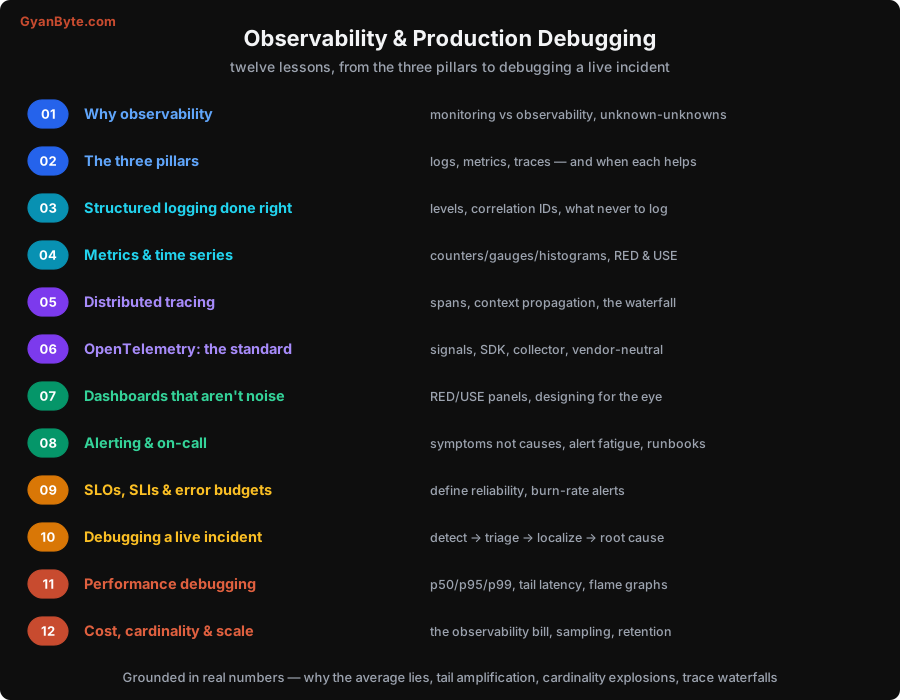
What This Course Covers
| # | Lesson | What you will learn |
|---|---|---|
| 1 | Why Observability | Monitoring vs observability; known- vs unknown-unknowns |
| 2 | The Three Pillars | Logs, metrics, traces — and how they work together |
| 3 | Structured Logging Done Right | Structured JSON, levels, correlation IDs, what never to log |
| 4 | Metrics & Time Series | Counters/gauges/histograms, RED, USE, the four golden signals |
| 5 | Distributed Tracing | Spans, context propagation, the trace waterfall, sampling |
| 6 | OpenTelemetry | The vendor-neutral standard: SDK, collector, exporters |
| 7 | Dashboards That Aren’t Noise | Designing dashboards that answer a question at a glance |
| 8 | Alerting & On-Call | Symptoms not causes, alert fatigue, runbooks |
| 9 | SLOs, SLIs & Error Budgets | Defining reliability as a number; burn-rate alerts |
| 10 | Debugging a Live Incident | A repeatable detect→triage→localise→root-cause workflow |
| 11 | Performance Debugging | Percentiles, tail amplification, flame graphs (measured) |
| 12 | Cost, Cardinality & Scale | Keeping the observability bill sane; sampling, retention |
Who Is This For?
- Backend/full-stack engineers who own services in production and get paged
- Teams moving to microservices who find their old monitoring no longer explains failures
- Anyone adopting OpenTelemetry, Prometheus, Grafana, Jaeger, or a vendor like Datadog
- Engineers who want to debug faster, define SLOs, and stop drowning in alerts and bills
How to Use It
Read it in order the first time — it builds from the pillars up to debugging and cost. Then keep it as a reference: when you’re instrumenting a service (Lessons 3–6), designing a dashboard or alert (Lessons 7–8), setting SLOs (Lesson 9), in the middle of an incident (Lesson 10), chasing a slow endpoint (Lesson 11), or facing a telemetry bill (Lesson 12), come back to that lesson. The pitfalls sections are where the hard-won operational lessons live.
Let’s start by getting the foundational distinction right: the difference between monitoring a system and being able to observe it.