Logs are the oldest and most familiar observability signal — everyone has written print("got here"). But the difference between logging that helps you in production and logging that just fills disk is large, and it comes down to a few deliberate choices. This lesson is about logging done right: structured so a machine can query it, tagged so you can correlate it, careful about secrets and cost.
Structured, Not Plaintext
The first and biggest shift: log structured data (JSON with named fields), not free-form sentences.
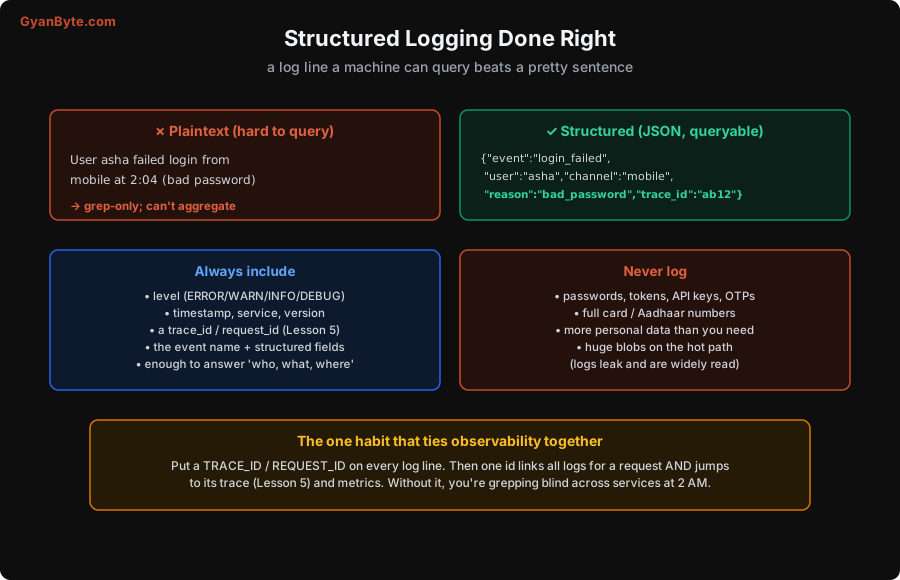
A plaintext line like User asha failed login from mobile at 2:04 (bad password) reads nicely to a human but is hard for a machine: to answer “how many mobile login failures in the last hour?” you’re writing fragile regex over text. The structured version — {"event":"login_failed","user":"asha","channel":"mobile","reason":"bad_password","trace_id":"ab12"} — lets your log platform filter and aggregate on fields: count by reason, group by channel, filter by trace_id. In a modern log system (Loki, Elasticsearch, a vendor), structured logs become queryable data, not just text you grep. This one change turns logs from a last-resort text dump into a genuine analytical tool, and it’s the baseline every logging library now supports.
Levels, and What to Always Include
Use log levels deliberately, because they control both signal and cost:
- ERROR — something failed that needs attention. These should be rare and real; every ERROR is a potential page or investigation.
- WARN — something unexpected but handled; worth noticing, not alarming.
- INFO — normal significant events (a request served, a job completed). The bulk of useful operational logs.
- DEBUG — detailed developer diagnostics, usually off in production (too voluminous and costly) and turned on when investigating.
Getting levels right matters: logging everything at ERROR makes ERROR meaningless (and noisy); logging real failures at INFO buries them. And make every log line carry enough context to be useful on its own:
- level, timestamp, service name, and version — so you know what emitted it, when, and from which deploy.
- a trace_id / request_id (below — the crucial one).
- the event name plus structured fields — enough to answer who, what, where without hunting for surrounding lines.
A log you find during an incident should tell you the story by itself, not require you to reconstruct context from ten lines around it.
The One Habit That Ties It Together: the Correlation ID
If you take one thing from this lesson, take this: put a trace_id / request_id on every single log line. It is the highest-leverage logging habit there is.
Here’s why it’s transformative. In a distributed system, one user request produces log lines across many services. Without a shared ID, those lines are scattered and anonymous — during an incident you’re grepping across services trying to guess which lines belong to the failing request. With a trace_id on every line, you filter to one ID and instantly see all logs for that one request, in order, across every service. And because that same ID is the trace ID (Lesson 5) and links to metrics (Lesson 2), you can jump from a metric spike → the trace → the exact logs for the same request. This correlation is what makes an incident solvable in minutes instead of hours (Lesson 10). Generate the ID at the edge (or inherit it from the incoming request), propagate it through your call context, and include it in every log automatically (most logging setups let you bind it once per request). It’s a small amount of plumbing for an enormous payoff.
What You Must Never Log
Logs are widely readable (developers, ops, your log vendor, backups) and long-lived, which makes them a serious data-leak risk. So, exactly as in the security course:
- Never log passwords, tokens, API keys, OTPs, session IDs.
- Never log full card numbers or Aadhaar numbers (and comply with PCI/DPDP).
- Never log more personal data than the log’s purpose requires.
- Avoid dumping huge blobs (entire request bodies, big objects) on the hot path — it’s expensive and often leaks data.
A secret in a log is a leaked secret. Use your logging library’s redaction/masking so sensitive fields are scrubbed even if someone accidentally logs an object containing one. This isn’t optional hygiene; it’s the difference between a log archive being a useful tool and being a breach waiting to happen.
Watch the Cost
Logs are usually the most expensive pillar at scale (Lesson 12). As the measured example there shows, a busy service can generate terabytes of logs per day, costing a lot just to ingest. So log deliberately, not reflexively:
- Don’t log on every trivial step of the hot path; log significant events.
- Sample high-volume INFO logs if needed (keep all ERRORs).
- Set retention to what you actually investigate (recent logs hot and searchable, older ones cheaper/colder or dropped).
- Put aggregates in metrics (cheap), not in a flood of logs you then count.
The goal is logs that are rich where it matters (errors, key events, with full context and a trace_id) and restrained where it doesn’t — maximum debugging value per rupee.
Pitfalls to Avoid
- Plaintext logs. Hard to query or aggregate. Log structured JSON with named fields so your platform can filter and count.
- No trace_id/request_id. The single biggest miss — without it you grep blind across services. Put a correlation ID on every line.
- Misusing levels. Everything at ERROR (meaningless) or real failures at INFO (buried). Use levels deliberately.
- Logging secrets or excess PII. Logs leak and are widely read. Never log passwords/tokens/OTPs/card/Aadhaar; redact sensitive fields.
- Logs that need surrounding context. Each line should tell its own story (who/what/where). Include enough structured fields.
- Reflexive, un-costed logging. Logs are the priciest pillar. Log significant events, sample high-volume info, set retention, and push aggregates to metrics (Lesson 12).
Quick Recap
- Use structured (JSON) logging, not plaintext, so logs become queryable, aggregatable data.
- Use levels deliberately (ERROR/WARN/INFO/DEBUG) and include level, timestamp, service, version, a trace_id, event name and fields — enough to answer who/what/where.
- The highest-value habit: a trace_id / request_id on every log line, so one ID links all a request’s logs and jumps to its trace and metrics (Lesson 2).
- Never log passwords, tokens, OTPs, card/Aadhaar, or excess PII — logs leak; redact sensitive fields.
- Watch cost (logs are the priciest pillar): log deliberately, sample high-volume info, set retention, push aggregates to metrics (Lesson 12).
Next lesson: the second pillar — metrics — the cheap, aggregatable numbers behind every dashboard and alert, with the RED/USE methods, the four golden signals, and the cardinality trap to avoid.