There’s a trap waiting at scale that nobody warns you about until the invoice arrives: observability can cost more than the service it observes. A busy system generates staggering volumes of telemetry, and if you emit it all, store it all, and keep it forever, the bill becomes one of your largest line items — sometimes larger than the compute for the application itself. The good news is that, like latency (Lesson 11), this is an engineering problem with clear levers. This final lesson is how to keep observability rich and affordable.
Where the Money Goes — and How to Cut It
Each pillar has a different cost profile and a different lever.
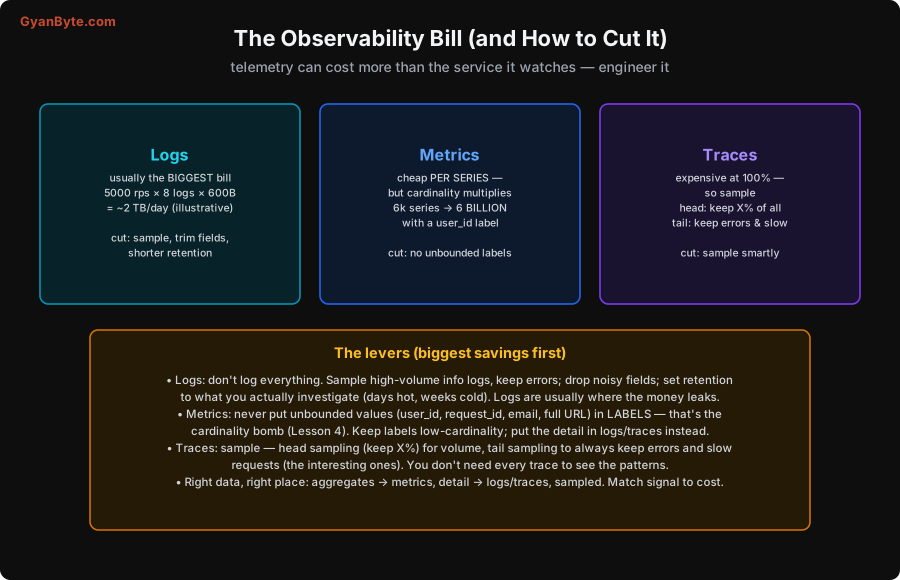
Logs — usually the biggest bill. The measured example: 5,000 requests/sec × 8 log lines/request × 600 bytes ≈ 2 TB per day (illustrative), which at ingest pricing runs into tens of thousands of dollars a month just to ingest. Logs are verbose and detailed, which makes them valuable but expensive. The levers:
- Don’t log everything. Sample high-volume INFO logs (keep a fraction), but always keep ERRORs. Most of your log volume is routine success logs you’ll never read.
- Drop noisy fields. Trim fields that add volume without debugging value.
- Set retention to what you actually investigate — recent logs hot and searchable (days), older ones in cheaper cold storage (weeks) or dropped. You rarely grep last quarter’s debug logs.
Logs are usually where the money leaks, so start here.
Metrics — cheap per series, but cardinality multiplies. A single metric series is cheap; the danger is the number of series exploding (Lesson 4). The measured example: 6,000 series becomes 6 billion by adding a user_id label. The lever is simple and absolute:
- Never put unbounded values in labels — no
user_id,request_id,email, fullurl, session ID. Keep labels low-cardinality (endpoint names, methods, status codes). This is the cardinality bomb, and it’s the #1 way metrics bills (and time-series databases) blow up. High-cardinality detail belongs in logs/traces, not metric labels.
Traces — expensive at 100%, so sample. Tracing every request is a lot of data (Lesson 5). The lever is smart sampling:
- Head sampling — keep X% of all traces (cheap, simple, but may miss the specific bad one).
- Tail sampling — always keep the interesting ones: errors and slow requests, dropping boring fast successes. You get the traces that teach you something without paying for the ones that don’t.
The Overarching Rule: Right Data, Right Place
Underneath all the specific levers is one principle that governs observability cost: put the right kind of data in the right (cheap) place.
- Aggregates and trends (rates, counts, percentiles) → metrics. Cheap, and exactly what metrics are for. Don’t compute these by counting a flood of logs.
- High-cardinality per-request detail (which user, which order, the exact error) → logs and traces (sampled), not metric labels. This is where detail belongs and is affordable.
- Request journeys → traces (sampled to keep errors/slow).
Most observability cost blowouts come from putting data in the wrong pillar: per-request detail stuffed into metric labels (cardinality explosion), or aggregates computed from mountains of logs (log bill explosion). Match each signal to the pillar designed for it, and cost mostly takes care of itself. When you add a new piece of telemetry, ask: “is this an aggregate (→ metric), per-request detail (→ log/trace), or a journey (→ trace)?” — and “how much volume/cardinality does it add?”
Observability Is Worth Paying For — Deliberately
A balancing note, so this doesn’t read as “turn everything off.” Observability is worth paying for — the cost of not being able to debug a production incident (longer outages, lost users, engineer-hours flailing) usually dwarfs the telemetry bill. The goal isn’t to minimise observability spend to zero; it’s to spend it well — rich signal where it helps you debug, restraint where it just burns money. An under-observable system saves on telemetry and loses far more in incident time.
So treat the observability pipeline as something you engineer and review, like any other system with a cost:
- Review the bill periodically and trace spikes to their source (a new high-cardinality label, a chatty new log line). Observability cost creeps up silently as the system grows.
- Attribute cost to teams/services so the people generating the telemetry see (and own) its cost — that alignment drives sensible behaviour.
- Tune continuously, as you would alerts (Lesson 8): sampling rates, retention, which logs/metrics are actually used. Delete telemetry nobody queries.
- Right-size by value: the critical payment path deserves rich tracing and logging; a low-stakes internal batch job doesn’t need the same investment.
Done well, you get the observability you need to debug fast (the whole point of this course) without the bill quietly becoming one of your largest. That balance — rich enough to understand your system, lean enough to afford it — is the final skill of production observability.
Pitfalls to Avoid
- Un-engineered telemetry at scale. Emit-store-keep-everything makes observability one of your biggest bills. Engineer it like any costed system.
- High-cardinality metric labels.
user_id/request_idin labels explodes series (6k → 6 billion) and the bill. Keep labels low-cardinality; detail → logs/traces. - Logging everything forever. Logs are the priciest pillar. Sample high-volume info (keep errors), drop noisy fields, set sensible retention.
- Tracing 100% of requests. Too expensive. Sample — tail-sample to always keep errors and slow requests (Lesson 5).
- Wrong data in the wrong pillar. Aggregates computed from logs, or per-request detail in metric labels — both blow up cost. Match signal to pillar.
- Minimising observability to save money. Under-observability costs far more in incident time. Spend well, not little — rich where it helps, lean where it doesn’t.
Quick Recap
- At scale, telemetry can cost more than the service — engineer it. Logs are usually the biggest bill (~2 TB/day in the example): sample info (keep errors), trim fields, set retention.
- Metrics are cheap per series but cardinality multiplies (6k → 6 billion with a user_id label): never put unbounded values in labels.
- Traces: sample — head for volume, tail to always keep errors and slow requests.
- The rule: right data, right place — aggregates → metrics, detail → sampled logs/traces, journeys → traces. Match signal to cost.
- Observability is worth paying for — spend it well (rich where it helps debug, lean where it doesn’t), and review the bill as the system grows.
That’s the course. You now have the full picture of production observability: why it matters and how it differs from monitoring, the three pillars (logs, metrics, traces) and how they combine through a shared correlation ID, structured logging, metrics with RED/USE and the cardinality trap, distributed tracing and the waterfall, OpenTelemetry, dashboards that answer questions, humane alerting, SLOs and error budgets, a repeatable incident-debugging workflow, performance debugging with percentiles and flame graphs, and the cost engineering to keep it all affordable. Instrument your systems to be understood, practise the metric → trace → log workflow, and the next 2 AM incident becomes a procedure you can run calmly instead of a mystery you dread.