Everything in this course has been building toward this moment: it’s 2 AM, an alert fired, users are affected, and you have to fix it. This is where observability pays off — or where its absence hurts most. But good observability alone isn’t enough; you also need a repeatable workflow so that under pressure you follow a path instead of flailing. This lesson is that workflow, and it’s deliberately the same metric → trace → log progression the three pillars were built for.
The Incident-Debugging Workflow
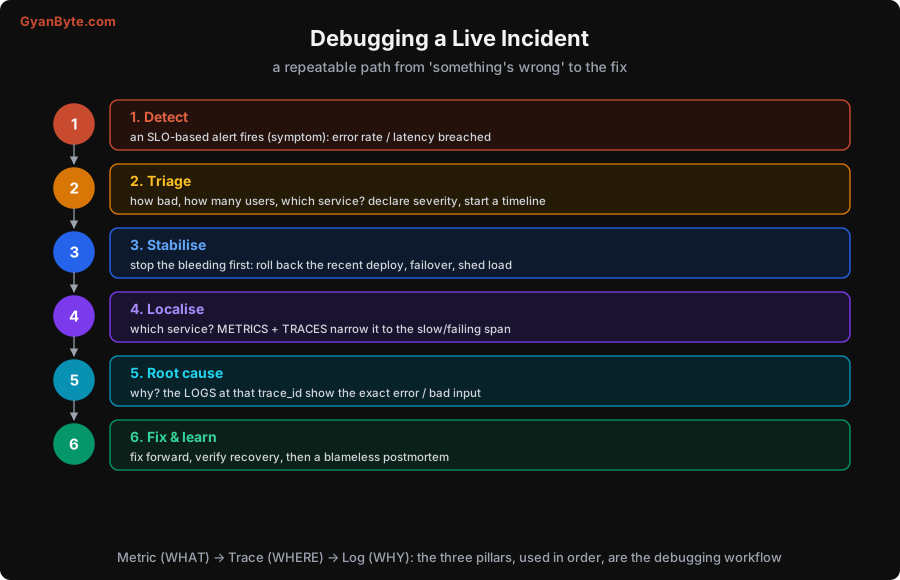
Follow the six steps in order:
1. Detect. An SLO-based alert fires (Lessons 8–9) — a symptom: error rate up, p99 latency over the SLO, users can’t log in. Because you alert on symptoms, not causes, you know from the first second that users are actually affected, not that some internal metric twitched.
2. Triage. Before diving in, size it up: how bad, how many users, which service or feature? Declare a severity (is this all-hands, or one person investigating?) and start an incident timeline — note what you see and do, with timestamps. The timeline keeps a stressed team coordinated and becomes the raw material for the postmortem (step 6). Resist the urge to immediately start poking; thirty seconds of triage focuses the whole response.
3. Stabilise — before you diagnose. This is the step people get wrong. When the site is down, stop the bleeding first: roll back the recent deploy (the most common cause — “what changed?”), fail over to a healthy region, shed load, or disable the broken feature. Restoring service for users beats understanding the root cause while they suffer. The instinct to fully understand before acting is wrong in a live outage — mitigate now, investigate from a calm place once users are okay. (If a recent deploy correlates with the alert, rolling it back is often both the fastest mitigation and a strong clue to the cause.)
4. Localise — with metrics and traces. Now narrow it down. Metrics tell you which service/signal is abnormal (“order-service error rate spiked”); traces (Lesson 5) narrow it further to the specific slow or failing span within the request — often a dependency you didn’t expect, two levels deep (the Stripe-call example). This is the “WHERE” — you’ve gone from “something’s wrong” to “it’s this operation in this service.”
5. Root cause — with logs. At that service and that moment, pull the logs for the failing requests — filtered by the trace_id (Lesson 3) so you see exactly the right lines across services. They show the “WHY”: the exact error (“connection pool exhausted”), the bad input, the stack trace. This is where the shared correlation ID (Lesson 2) earns its keep — you jump from the trace straight to the precise logs, instead of grepping blind.
6. Fix and learn. Apply the real fix (fix forward now that it’s understood, or make the stabilisation permanent), verify recovery (watch the SLI return to healthy — don’t declare victory on hope), and then — crucially — run a blameless postmortem: what happened, how the system allowed it, and what to change so it can’t recur. The output is a small number of concrete, owned action items (often including a better alert or more observability for next time), not blame on a person.
The Backbone: Metric → Trace → Log
Notice what steps 4–5 are: the three pillars, used in order.
- Metric tells you WHAT is wrong (and alerts you to it): a signal is abnormal.
- Trace tells you WHERE: which service and span in the request.
- Log tells you WHY: the exact error at that point.
This progression — what → where → why — is the entire reason you instrumented all three pillars and tied them with a shared ID (Lesson 2). In a system with good observability, this flow is fast: alert → open the dashboard → click the spike → open the trace → read the logs → root cause, in minutes, by one trace_id. In a system without it, you’re SSHing into boxes, grepping unstructured logs, guessing which service, and adding logging + redeploying while users wait — hours, not minutes. The workflow is the payoff of everything earlier in the course.
Two Principles Worth Burning In
Two ideas from the workflow deserve emphasis because people get them wrong under stress:
- Stabilise before you diagnose. In a live outage, mitigate (roll back, failover, shed load) first; understand later. Users down is the emergency; root cause can wait a few minutes until they’re served. The engineer who insists on understanding before acting prolongs the outage.
- Blameless postmortems. When it’s over, fix the system, not the person. “Human error” is a starting point, not a conclusion — ask why the system made that error easy (no guardrail, no canary, a confusing default) and fix that. A blame culture makes people hide mistakes and near-misses, which is exactly the information you need to prevent the next incident. A blameless one surfaces problems and gets steadily more reliable. (This mirrors the security and distributed-systems courses’ take on incident reviews, because it’s universal.)
Put together: a disciplined workflow (detect → triage → stabilise → localise → root-cause → learn), powered by the three pillars used in order, turns the worst moment — a live incident — from panic into procedure. That calm, repeatable procedure, more than any single tool, is what good observability buys you.
Pitfalls to Avoid
- Diagnosing before stabilising. Users are down now; roll back/failover/shed load first, understand later. Restoring service beats a live root-cause hunt.
- Skipping triage. Diving in without sizing severity and impact wastes the response. Thirty seconds of triage + a timeline focuses everyone.
- Grepping logs first in a big system. That’s starting at “why” without “where.” Go metric → trace → log; let traces localise before you read logs.
- No shared trace_id. Without it, step 5 is grepping blind across services. Correlate everything (Lessons 2–3) so the jump to the right logs is instant.
- Declaring victory on hope. Verify recovery by watching the SLI return to healthy, not by assuming the fix worked.
- Blameful postmortems (or none). Blame hides the near-misses you need; skipping the review repeats the incident. Fix the system, blamelessly, with owned action items.
Quick Recap
- The workflow: Detect (SLO symptom alert) → Triage (severity, impact, timeline) → Stabilise (roll back/failover before diagnosing) → Localise (metrics + traces → the span) → Root cause (logs at the trace_id) → Fix & learn (verify recovery, blameless postmortem).
- The backbone is the three pillars in order: metric (WHAT) → trace (WHERE) → log (WHY) — the payoff of instrumenting all three and tying them with a shared ID.
- Stabilise before you diagnose — restoring service beats understanding while users suffer.
- Run blameless postmortems — fix the system, not the person; the output is a few owned action items (often better alerts/observability).
Next lesson: a specialised and common form of debugging — performance — why the average latency lies, how tail latency amplifies across services, and how flame graphs find the hot code.