The previous lessons showed what to emit — structured logs, metrics, traces — but not how to emit them in a way that isn’t tied to one vendor’s agent and format. That’s what OpenTelemetry (OTel) solves, and it’s become the de-facto standard, so it’s worth understanding even if a framework or vendor handles the details for you. The one-line pitch: instrument your code once, in a vendor-neutral way, and send the telemetry anywhere.
One Standard for All Three Signals
Before OpenTelemetry, instrumentation was a mess: each vendor (Datadog, New Relic, etc.) had its own agent, SDK and format, and tracing had competing standards (OpenTracing, OpenCensus). If you instrumented for one vendor and wanted to switch, you re-instrumented everything — painful lock-in. OTel, a CNCF project, unified all of it.
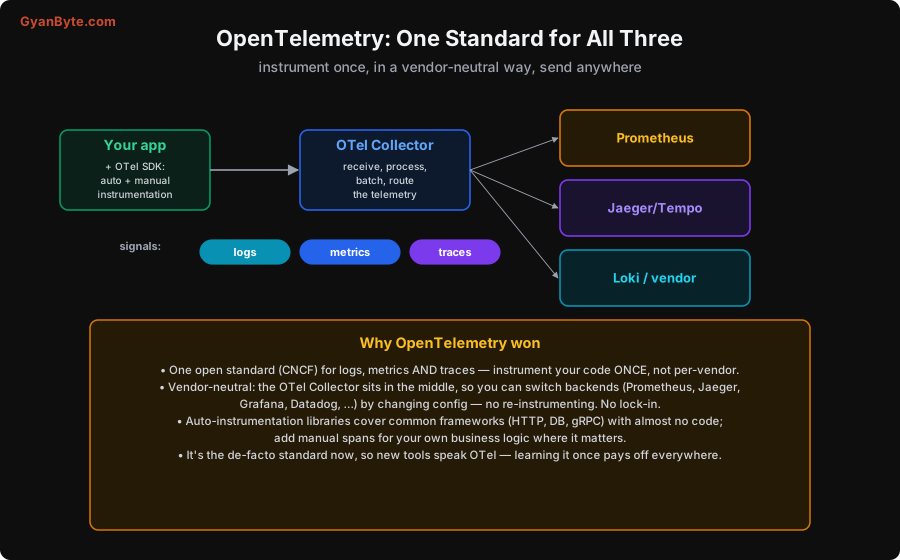
The architecture has three parts:
- The SDK (in your app). You add the OpenTelemetry SDK for your language, and it produces the three signals — logs, metrics, and traces — in a standard format. This is where instrumentation happens (below).
- The Collector (in the middle). A separate process that receives telemetry from your apps, processes it (batching, filtering, sampling — Lesson 5), and routes it onward. This middle layer is the key to vendor-neutrality.
- Exporters (to the backends). The Collector exports to whatever backends you use — Prometheus (metrics), Jaeger/Tempo (traces), Loki (logs), or a commercial vendor like Datadog. You can send to several at once.
Your application only knows about OpenTelemetry; it has no idea which backend the data ends up in. That decoupling is the whole trick.
Auto vs Manual Instrumentation
Getting telemetry out of your code is less work than you’d fear, because of auto-instrumentation:
- Auto-instrumentation libraries hook into common frameworks — HTTP servers and clients, database drivers, gRPC, message queues — and emit spans and metrics for them with almost no code (often just enabling a package). This covers the boundaries of your service (incoming requests, outgoing calls, DB queries) for free, which is most of what you need for a trace waterfall (Lesson 5).
- Manual instrumentation is where you add spans and metrics for your own business logic — a complex computation, a multi-step workflow, a cache lookup — that auto-instrumentation can’t know about. You wrap the operation in a span (
with tracer.start_span("build_report"): ...) and add attributes. This is where you make your logic visible, so the waterfall shows your code, not just framework calls.
The practical approach: turn on auto-instrumentation to get the boundaries cheaply, then add manual spans and custom metrics where your service does something significant and non-obvious. You get broad coverage fast, with depth where it matters.
Why OpenTelemetry Won (and Why You Should Use It)
The reasons OTel became the standard are the reasons to adopt it:
- One standard for all three signals. Instrument once for logs, metrics and traces, in a consistent way, instead of three different systems with three formats.
- Vendor-neutral, no lock-in. Because the Collector sits between your app and the backend, switching observability backends (from one vendor to another, or from a vendor to open-source Prometheus/Grafana/Jaeger) is a config change in the Collector, not a re-instrumentation of your whole codebase. This freedom is worth a lot — observability vendors are expensive, and being able to switch keeps you in control.
- It standardises context propagation (the W3C
traceparentheader, Lesson 5), which is what makes cross-service tracing actually interoperate — a span from a Go service and a span from a Python service stitch into one trace because they speak the same standard. - It’s the de-facto standard, so new tools, libraries and vendors speak OTel. Learning it once is an investment that pays off across your whole career and stack, not a single-vendor skill.
You don’t have to become an OTel internals expert — many platforms and frameworks wire it up for you — but understanding the model (SDK → Collector → backends, auto + manual instrumentation, vendor-neutral by design) lets you set it up sensibly, debug it when telemetry goes missing, and avoid lock-in.
Pitfalls to Avoid
- Vendor-specific instrumentation. Tying your code to one vendor’s agent means re-instrumenting to switch. Use OpenTelemetry for vendor-neutral, portable instrumentation.
- Only auto-instrumentation. You get framework boundaries but not your own logic. Add manual spans/metrics for significant business operations.
- Skipping the Collector. Sending directly from apps to a backend loses the central place to sample, filter and re-route. The Collector is where you control cost and flexibility.
- Inconsistent instrumentation across services. If one service doesn’t propagate context (Lesson 5), traces break. Standardise on OTel everywhere for interoperability.
- Over-instrumenting on day one. You don’t need a span on every function. Start with auto-instrumentation + key manual spans; add detail where debugging actually needs it.
- Ignoring OTel because “the vendor handles it.” Even with a vendor, understanding the model helps you debug missing telemetry and keeps the door open to switch.
Quick Recap
- OpenTelemetry is the open (CNCF) standard for all three signals — instrument once, vendor-neutral, instead of per-vendor.
- The model: SDK in your app produces telemetry → Collector receives/processes/routes → exporters send to any backend (Prometheus, Jaeger, Loki, vendors).
- Auto-instrumentation covers common frameworks (HTTP/DB/gRPC) cheaply; add manual spans/metrics for your own business logic.
- The Collector decouples app from backend, so you switch backends by config — no lock-in; OTel also standardises context propagation (Lesson 5).
- It’s the de-facto standard, so learning it once pays off everywhere.
Next lesson: turning all this telemetry into something humans can actually use at a glance — dashboards that answer a question instead of adding noise.