

Data is the raw material of every strategy, and getting the right data is the first real hurdle in algo trading — before any clever model. The questions are always: what kind of data do I need, where do I get it, and what will quietly ruin my backtest if I’m careless? This article answers all three, with Python you can run today.
A note up front: educational material, not financial advice. Nothing here is a recommendation to trade.
The levels of market data
“Market data” isn’t one thing — it’s a ladder from a coarse daily summary to every individual order. More detail means more cost, more storage, and more engineering.
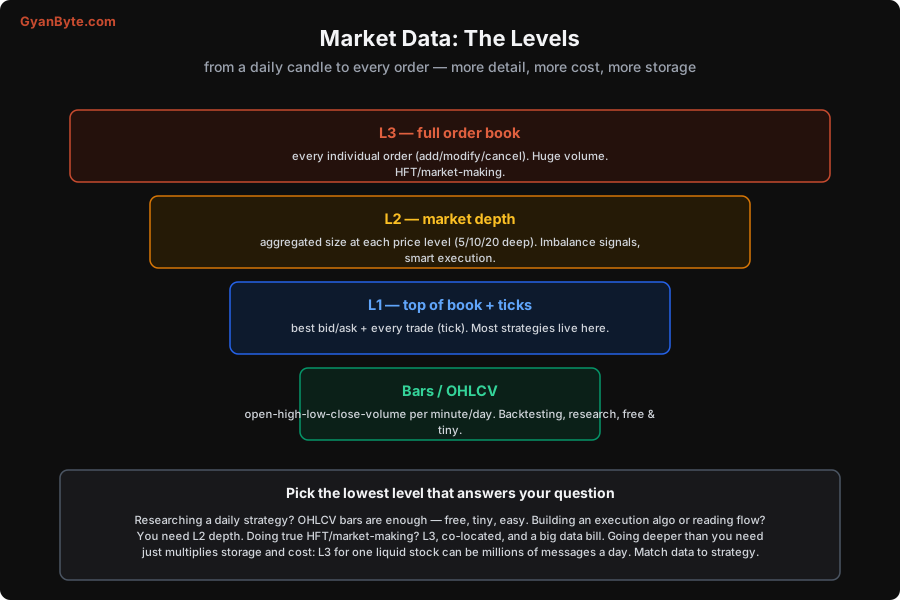
- Bars (OHLCV) — Open/High/Low/Close/Volume per minute or day. Tiny, free, and enough for most research and backtesting. Start here.
- L1 — top of book + ticks — the best bid/ask and every individual trade (a “tick”). Most strategies live here.
- L2 — market depth — aggregated size at several price levels on each side. You need this for execution algorithms and order-book imbalance signals.
- L3 — full order book — every individual order (add/modify/cancel). Enormous volume (millions of messages a day for one liquid stock), and the domain of HFT and market making.
The rule: pick the lowest level that answers your question. Researching a daily strategy? Bars. Building an execution algo? L2. Going deeper than you need just multiplies cost and storage for nothing.
Where to get it
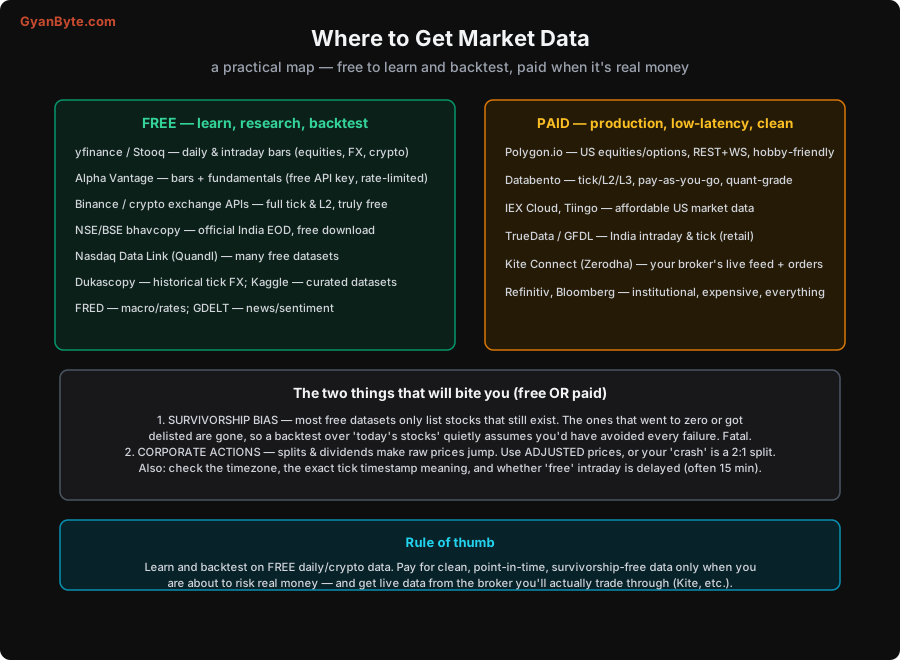
Free — to learn, research and backtest
- yfinance — the easiest start: daily and intraday bars for equities, FX and crypto, free.
- Stooq — free daily history, good for quick CSV pulls (works via
pandas-datareader). - Crypto exchange APIs (Binance, etc.) — the best free deal in the business: full tick and L2 depth, no paywall, clean REST/WebSocket APIs. If you want real microstructure data to learn on, crypto is where to go.
- NSE / BSE bhavcopy — official Indian end-of-day data, free to download.
- Alpha Vantage — bars plus fundamentals with a free (rate-limited) API key.
- Nasdaq Data Link (formerly Quandl), Dukascopy (historical tick FX), Kaggle (curated datasets), FRED (macro/rates), GDELT (news/sentiment).
A few lines gets you going. Equities/crypto bars with yfinance:
import yfinance as yf

# daily, split/dividend-ADJUSTED prices (important — see the traps below)
df = yf.download("RELIANCE.NS", start="2020-01-01", auto_adjust=True)
print(df[["Open", "High", "Low", "Close", "Volume"]].tail())
Free crypto tick-level data straight from an exchange, via the ccxt library (one interface for 100+ exchanges):
import ccxt, pandas as pd

ex = ccxt.binance()
ohlcv = ex.fetch_ohlcv("BTC/USDT", timeframe="1m", limit=1000)
df = pd.DataFrame(ohlcv, columns=["ts", "open", "high", "low", "close", "vol"])
df["ts"] = pd.to_datetime(df["ts"], unit="ms")
print(df.tail())
Paid — for production, low-latency, and clean history
When real money is involved, you pay for clean, point-in-time, survivorship-free data and reliable live feeds:
- Polygon.io — US equities and options, REST + WebSocket, hobby-friendly pricing.
- Databento — tick, L2 and L3, pay-as-you-go, genuinely quant-grade.
- IEX Cloud, Tiingo — affordable US market data.
- TrueData / GFDL — Indian intraday and tick data aimed at retail.
- Kite Connect (Zerodha) — your broker’s live feed and order API; this is what you actually trade through in India.
- Refinitiv, Bloomberg — institutional, expensive, and they have everything.
Live data you’ll actually trade on usually comes from your broker. A Kite Connect historical pull looks like:
from kiteconnect import KiteConnect

kite = KiteConnect(api_key="your_key")
kite.set_access_token("your_token")
# instrument_token from kite.instruments(); 'minute' bars for one day
candles = kite.historical_data(instrument_token=408065,
                               from_date="2026-10-29 09:15:00",
                               to_date="2026-10-29 15:30:00",
                               interval="minute")
The two traps that will bite you (free or paid)
More backtests are ruined by data problems than by bad strategies. Two in particular:
-
Survivorship bias. Most free datasets only list securities that still exist. Every company that went to zero, got delisted, or was acquired is simply missing. So a backtest over “today’s stocks” quietly assumes you’d have owned only the survivors — that you’d have dodged every failure in advance. This makes almost any strategy look good and is one of the most common ways people fool themselves. Point-in-time, survivorship-free data (paid) is the fix when it matters.
-
Corporate actions. Splits and dividends make raw prices jump discontinuously — a 2-for-1 split halves the price overnight, which a naive backtest reads as a −50% crash. Always use adjusted (or “back-adjusted”) prices (
auto_adjust=Truein yfinance), or handle the actions yourself.
Two more to check every time: timezones (is that timestamp exchange-local or UTC?) and delay (a lot of “free” intraday data is delayed 15 minutes, which is fine for research and useless for live trading).
Rule of thumb
Learn and backtest on free daily or crypto data — it’s plenty to understand every strategy in this series. Pay for clean, point-in-time, survivorship-free data only when you’re about to risk real money, and get your live feed from the broker you’ll actually trade through.
Next, put this data to work: the moving-average crossover — the “hello world” strategy — backtested honestly in Python. For the full systems view (building and maintaining a live data feed, L2 book from a WebSocket, reconnection and sequence gaps), see the Low-Latency Trading Systems course.


