

Momentum is, along with value, one of the most robust and widely-documented patterns in markets: assets that have been rising tend to keep rising, and those falling tend to keep falling, for long enough to trade. Unlike the crossover, momentum done properly has a real, persistent edge — but, as we’ll see, that edge shows up somewhere you might not expect.
A note up front: educational material, not financial advice. Nothing here is a recommendation to trade.
The idea: ride trends, step aside when they break
The rule is simple: own what’s going up; get out when it rolls over. The two standard ways to measure “going up”:
- Time-series momentum — look at an asset’s own past return. If its last 12 months are positive, hold it; if negative, go to cash (or short). Each asset is judged against its own history.
- Breakouts — buy when the price makes a new N-day high (the trend is confirming), exit when it makes a new low. Donchian channels are the classic version.
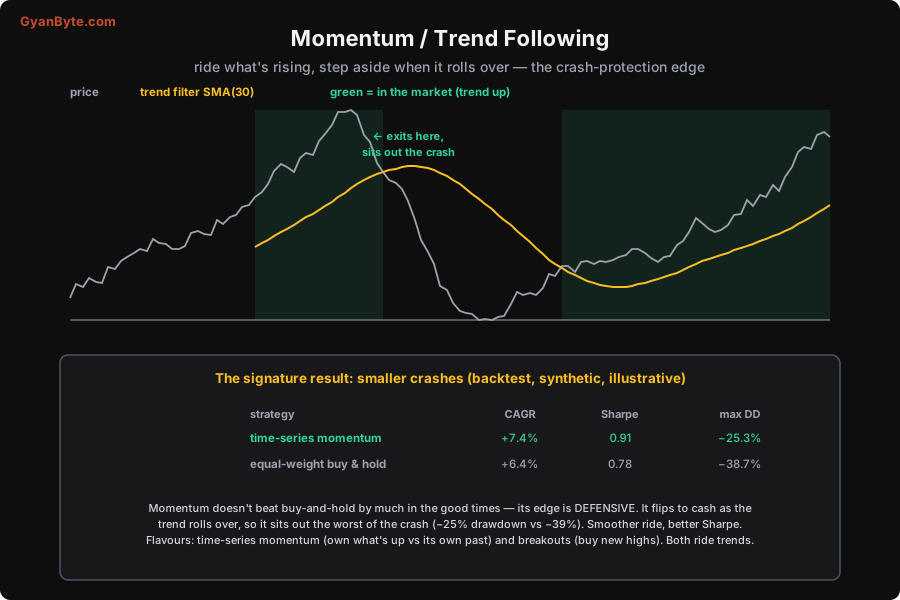
The green shaded regions in the diagram are when the strategy is in the market. Notice what happens at the crash: the trend filter turns down, the strategy exits to cash, and it sits out the worst of the fall — then re-enters when the trend turns back up.
The backtest, in full
Time-series momentum on a basket, rebalanced monthly:
import numpy as np
import pandas as pd
import yfinance as yf

# 1. A small basket; monthly closes
tickers = ["RELIANCE.NS", "TCS.NS", "HDFCBANK.NS", "INFY.NS", "ITC.NS"]
px = yf.download(tickers, start="2015-01-01", auto_adjust=True)["Close"]
monthly = px.resample("ME").last()
mret = monthly.pct_change().fillna(0)

# 2. Signal: hold an asset next month if its trailing 12-month return is positive
lookback = 12
mom = monthly.pct_change(lookback)
hold = (mom > 0).astype(float).shift(1).fillna(0)     # act next month (no look-ahead)

# 3. Equal-weight the held assets; compare to equal-weight buy & hold
weights = hold.div(hold.sum(axis=1).replace(0, np.nan), axis=0).fillna(0)
strat = (weights * mret).sum(axis=1)
bh    = mret.mean(axis=1)

def metrics(r, ppy=12):
    eq = (1 + r).cumprod()
    cagr = eq.iloc[-1] ** (ppy / len(r)) - 1
    sharpe = r.mean() / r.std() * np.sqrt(ppy)
    maxdd = (eq / eq.cummax() - 1).min()
    return cagr, sharpe, maxdd

for name, r in [("momentum", strat), ("buy & hold", bh)]:
    c, s, d = metrics(r)
    print(f"{name:11} CAGR {c*100:5.1f}%  Sharpe {s:4.2f}  maxDD {d*100:6.1f}%")
Same backtest loop as always — the only new idea is ranking each asset by its own trailing return and holding the winners.
The signature result: smaller crashes
On a synthetic basket that includes a crash:
| strategy | CAGR | Sharpe | max drawdown |
|---|---|---|---|
| time-series momentum | +7.4% | 0.91 | −25.3% |
| equal-weight buy & hold | +6.4% | 0.78 | −38.7% |
Look carefully at where momentum wins. The return edge over buy-and-hold is modest (+7.4% vs +6.4%). The real difference is the max drawdown: −25% vs −39%. Momentum’s edge is defensive — it doesn’t make dramatically more in the good times; it loses much less in the bad times, because it flips to cash as trends roll over and sits out the worst of the crash. That smaller drawdown is also why its Sharpe (risk-adjusted return) is higher: a smoother ride for similar return.
This is the key mental model for momentum: you’re buying crash protection, not a bigger number. In a steady bull market, momentum often lags buy-and-hold (it’s sometimes in cash, missing upside). It earns its keep in the drawdowns — which is exactly when it matters, because a −39% drawdown is far harder to recover from (and to emotionally survive) than a −25% one.
The cost: whipsaws
Momentum’s weakness is the same as any trend-follower’s: choppy, trendless markets whipsaw it. The trend filter flips in and out, each time a little late, racking up small losses and transaction costs with no trend to ride. Trend followers accept this — they take many small losses in sideways markets in exchange for catching the occasional big trend and dodging the big crashes. It’s a positively-skewed bet: frequent small losers, occasional large winners, and crucially, controlled downside. Sizing and costs matter a lot (you trade on every flip), which is why position sizing and execution are part of the same toolkit.
Takeaways
- Momentum = own what’s rising, exit when the trend breaks. Measure it with time-series returns (own-past-return positive) or breakouts (new highs).
- Its edge is defensive: on a crash test it cut drawdown from −39% to −25% while roughly matching the return — a smoother ride, higher Sharpe. You’re buying crash protection, not a bigger number.
- It whipsaws in sideways markets (many small losses) and sometimes lags in steady bull runs. The bet is positively skewed: small frequent losers, rare big winners, controlled downside.
- Same backtest loop as every strategy — the signal is just a trailing return or a breakout.
Next: not a strategy but a skill every strategy needs — execution: VWAP and TWAP, how to actually fill your orders without giving back your edge to the market.


