

If algo trading has a “hello world,” it’s the moving-average crossover. Every tutorial starts here, and for good reason: it teaches the entire backtest loop in a dozen lines. But most tutorials stop at “look, it makes money!” and quietly cherry-pick the chart. This one shows you the clean code and the honest result — which is more useful than another rigged equity curve.
A note up front: educational material, not financial advice. Nothing here is a recommendation to trade.
The idea
Take two moving averages of the price: a fast one (say 20 days) that reacts quickly, and a slow one (50 days) that reacts slowly. The rule:
- When the fast SMA crosses above the slow SMA, the recent trend is up → go long.
- When it crosses below, the trend has turned → go flat (sell, sit in cash).
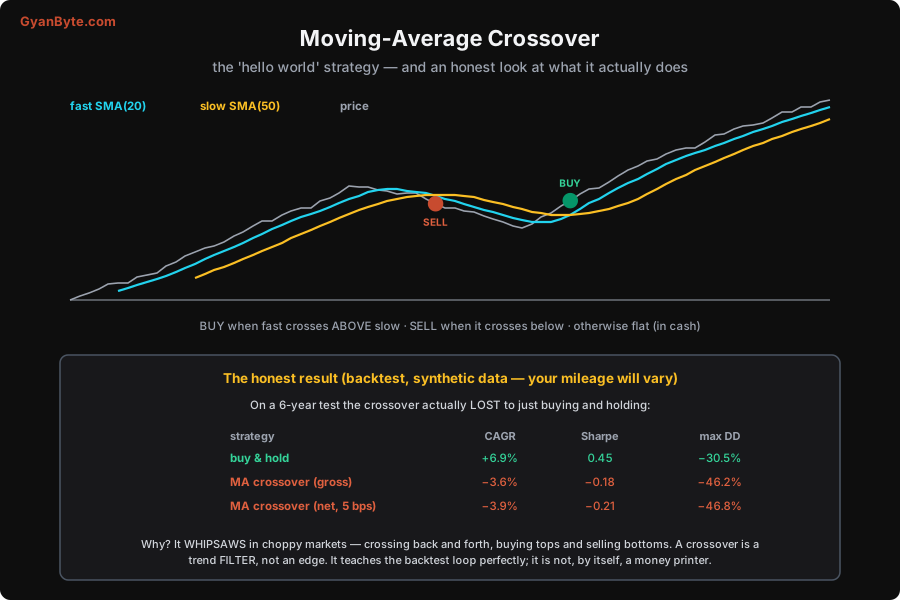
That’s the whole strategy. It’s intuitive — “ride the uptrends, step aside in downtrends” — which is exactly why it’s the first thing everyone builds.
The backtest, in full
Here’s a complete, runnable vectorised backtest in pandas. Swap the data line for any source from the market-data article.
import numpy as np
import pandas as pd
import yfinance as yf

# 1. Data — adjusted daily closes
px = yf.download("RELIANCE.NS", start="2019-01-01", auto_adjust=True)["Close"]
ret = px.pct_change().fillna(0)

# 2. Signal — fast vs slow SMA
fast = px.rolling(20).mean()
slow = px.rolling(50).mean()
# long (1) when fast > slow, else flat (0). SHIFT by 1 bar: you can only act on
# yesterday's signal at today's open — this avoids look-ahead bias.
signal = (fast > slow).astype(int).shift(1).fillna(0)

# 3. Strategy returns, gross and net of costs
strat_gross = signal * ret
turns = signal.diff().abs().fillna(0)          # 1 whenever we enter or exit
cost  = turns * 0.0005                          # 5 bps per trade (round-turn-ish)
strat_net = strat_gross - cost

# 4. Score it
def metrics(r, ppy=252):
    eq = (1 + r).cumprod()
    cagr = eq.iloc[-1] ** (ppy / len(r)) - 1
    sharpe = r.mean() / r.std() * np.sqrt(ppy)
    maxdd = (eq / eq.cummax() - 1).min()
    return cagr, sharpe, maxdd

for name, r in [("buy & hold", ret), ("MA gross", strat_gross), ("MA net", strat_net)]:
    cagr, sharpe, dd = metrics(r)
    print(f"{name:12} CAGR {cagr*100:6.1f}%  Sharpe {sharpe:5.2f}  maxDD {dd*100:6.1f}%")
The one line that separates a real backtest from a fantasy is .shift(1) on the signal: you can only trade on a signal after you’ve seen it, so you lag it by a bar. Forget it and you “trade” on information you didn’t have yet — the classic look-ahead bias that makes any strategy look brilliant.
The honest result
On a 6-year test (the numbers below are from a synthetic series with two crashes, so you can reproduce the shape of the result; real data will differ in the specifics but rarely in the lesson):
| strategy | CAGR | Sharpe | max drawdown |
|---|---|---|---|
| buy & hold | +6.9% | 0.45 | −30.5% |
| MA crossover (gross) | −3.6% | −0.18 | −46.2% |
| MA crossover (net, 5 bps) | −3.9% | −0.21 | −46.8% |
The crossover lost to simply buying and holding — lower return, negative Sharpe, and a worse drawdown. Costs made it slightly worse still. This is not a bug in the code; it’s the honest, typical outcome.
Why it loses — and what it’s actually for
The crossover’s weakness is whipsaw. In a choppy, sideways market the two averages cross back and forth repeatedly, and each time you buy just as the price turns down and sell just as it turns back up — buying tops, selling bottoms, bleeding a little on every round. It only shines in strong, sustained trends; the rest of the time it chops you up. It was in the market only ~55% of the time here, and the timing of those entries and exits hurt more than it helped.
The real lesson: a moving-average crossover is a trend filter, not an edge. It tells you “the trend is up” or “the trend is down” — useful context — but by itself it is not a reason to expect profit. Real strategies combine such filters with an actual source of edge (a mispricing, a structural quirk, a behavioural pattern) and, crucially, with risk and position sizing and good execution.
What the crossover is perfect for is learning the backtest loop: data → signal → lag it → returns → metrics. Master that pattern here and you can test any idea. Common variations you’ll meet — EMA (exponential) instead of SMA, the “golden cross” (50/200), adding a trend filter to another strategy — are all the same loop with different signal lines.
Takeaways
- The SMA crossover is the ideal first backtest: go long when fast > slow, flat otherwise.
- Always
.shift(1)the signal — trading on information you didn’t have yet is the #1 way to fool yourself. - Honestly tested, it often loses to buy-and-hold because it whipsaws in non-trending markets. A crossover is a filter, not an edge.
- Score every strategy on CAGR, Sharpe, and max drawdown — and be suspicious of any backtest that looks too good.
Next: a strategy with a genuine, market-neutral edge — mean reversion and pairs trading — and why trading the spread beats betting on direction. For the deep dive on not fooling yourself, see the backtesting lesson in the trading course.


