

The single most expensive habit in performance work is optimizing by gut feel. Someone decides a function “feels slow,” spends a week making it 3× faster, ships it — and nothing changes, because that function was never the bottleneck. This article is the foundation the rest of this series (backend, infrastructure, AI) stands on: you measure first, you fix the one thing that dominates, and you prove it with numbers. Everything else is detail.
The loop: measure, find, fix, re-measure
Every performance fix should go through the same four steps, in order.
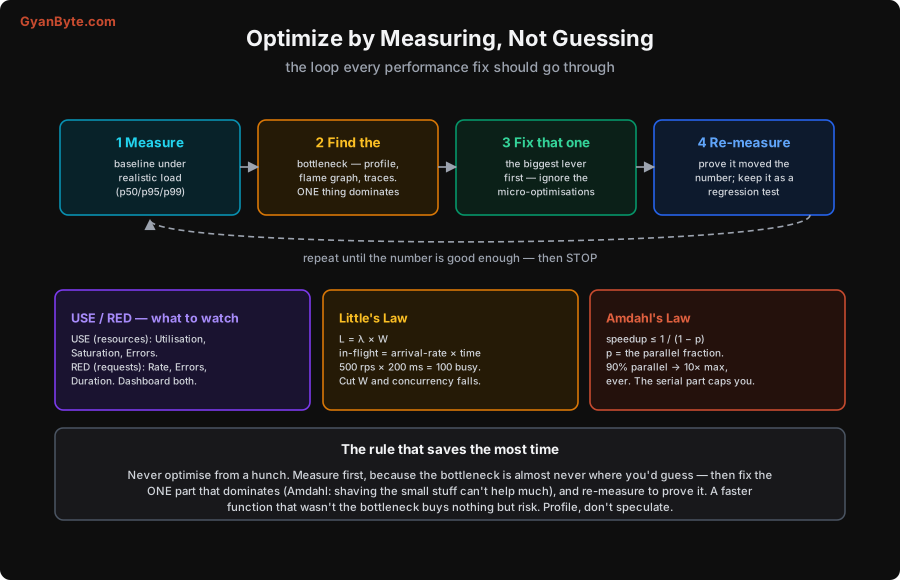
- Measure a baseline, under realistic load — real request mix, real data sizes, real concurrency. A benchmark of one request on an empty database tells you nothing.
- Find the bottleneck — profile the CPU, read a flame graph, follow a distributed trace. There is almost always one thing that dominates, and it is almost never where you guessed.
- Fix that one thing — the biggest lever, not the satisfying micro-optimization.
- Re-measure to prove the number moved, and keep the measurement as a regression test so it doesn’t creep back.
Then repeat until it’s good enough — and stop. Performance work has diminishing returns; knowing when to quit is part of the skill.
Measure percentiles, never the average
The most important habit is refusing to trust the average. Averages hide exactly the thing you care about.
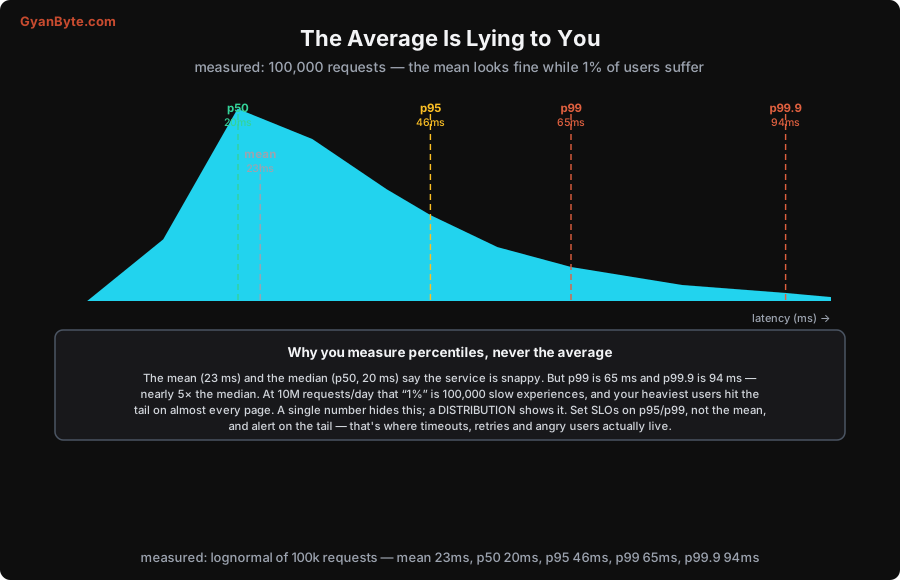
Here’s a real distribution of 100,000 request latencies. The mean is 23 ms and the median (p50) is 20 ms — sounds great. But:
mean 23 ms · p50 20 ms · p95 46 ms · p99 65 ms · p99.9 94 msp99 is 65 ms and p99.9 is 94 ms — nearly 5× the median. That “1%” isn’t rare: at 10 million requests a day it’s 100,000 slow experiences, and your heaviest users (who make the most requests per session) hit the tail on almost every page. A single number can’t show this; a distribution can. So:
- Set SLOs on p95/p99, not the mean. “p99 < 100 ms” is a target; “average < 100 ms” lets half your tail blow up invisibly.
- Alert on the tail, because that’s where timeouts, retries and cascading failures start.
- Never average percentiles across servers (you can’t average a p99) — aggregate the raw distribution instead.
This is the whole reason percentiles exist, and it’s covered in depth in the observability course.
The three laws that decide what’s worth fixing
Measurement tells you where the problem is. These three laws tell you whether fixing it will actually help — and they save you from expensive dead ends.
Little’s Law — latency is capacity
L = λ × W: the number of requests in flight equals arrival rate × time each spends in the system. At 500 req/s with 200 ms latency you have 100 requests in flight at all times; cut latency to 50 ms and that drops to 25. This is why latency and throughput aren’t separate problems — reducing latency directly reduces the concurrency (threads, connections, memory) you need to pay for. It also sizes your pools: if you need 100 concurrent and your connection pool is 20, you have a queue, not a pool.
Amdahl’s Law — the serial part is your ceiling
speedup ≤ 1 / (1 − p), where p is the fraction of work that parallelises. If 90% parallelises, 10× is the absolute most you can ever get — even with infinite cores — because the serial 10% (a lock, a single DB writer, a shared counter) caps everything. The lesson: find the serial bottleneck first. Throwing hardware at the parallel part once the serial part dominates just burns money.
Tail amplification — scale makes the tail the norm
When one request fans out to many services, the slow tails compound. If each backend is slow just 1% of the time (its p99):
fan-out   1  →   1.0% of requests are slow
fan-out  10  →   9.6% slow
fan-out 100  →  63.4% slow
At 100-way fan-out, 63% of requests wait on someone’s bad p99. This is why large systems obsess over tail latency: a “rare” slow call becomes a near-certainty once a request touches enough services. The cures are structural — cut fan-out, set tight timeouts, hedge requests — and they’re covered in the infrastructure scaling article.
What to put on the dashboard: USE and RED
Two simple checklists cover almost everything worth watching:
- USE (for resources) — for every resource (CPU, memory, disk, network, pool), track Utilisation, Saturation (queue depth / waiting), and Errors. Saturation is the early warning the others miss.
- RED (for requests) — for every service, track Rate (req/s), Errors (failures/s), and Duration (latency distribution).
Put both on a dashboard before you have a problem, so when latency spikes you can see whether it’s load (rate up), a dependency (duration up on one call), or a resource (saturation climbing) — in seconds, not hours.
Takeaways
- Measure before you optimize. The bottleneck is almost never where you’d guess; profile and trace to find the one thing that dominates, fix that, and re-measure to prove it.
- Track percentiles, not averages. The mean hides the tail (23 ms mean vs 94 ms p99.9 in a real sample); set SLOs on p95/p99 and alert on the tail.
- Little’s Law: cutting latency cuts the concurrency and cost you need — latency and throughput are the same problem.
- Amdahl’s Law: the serial fraction caps your speedup; find and fix it before adding hardware.
- Tail amplification: at scale, a “rare” slow call becomes the common case — make the tail fast, not just the median.
- Watch USE + RED so you can tell load from dependency from resource at a glance.
With the method in place, the rest of the series gets concrete: backend application performance, scaling the infrastructure, and AI/LLM application performance.
$ subscribe --weekly
One deep dive a week, in your inbox
System design, AI engineering, trading systems and interview prep. Tested code, real numbers. Free, and you can unsubscribe any time.
or read it on gyanbyte.substack.com


