

The invoice email lands and your AI spend is 4× last week. The instinct is to start frantically editing prompts and switching models — which is exactly how you waste two days and fix nothing. A bill spike is a debugging problem, and like any debugging problem it has a method: decompose, triage, isolate, fix — and then prevent. This article is that method. (It’s the firefighting companion to the calmer AI application performance guide.)
Step 1: Decompose the bill (don’t touch anything yet)
Every LLM bill obeys one identity, and the whole method comes from it:
daily cost = requests × tokens per request × price per tokenBecause it’s multiplicative, a spike lives in one — occasionally two — of those three factors, and usually one of them moved a lot. Your first job is not to fix anything; it’s to find which factor moved.
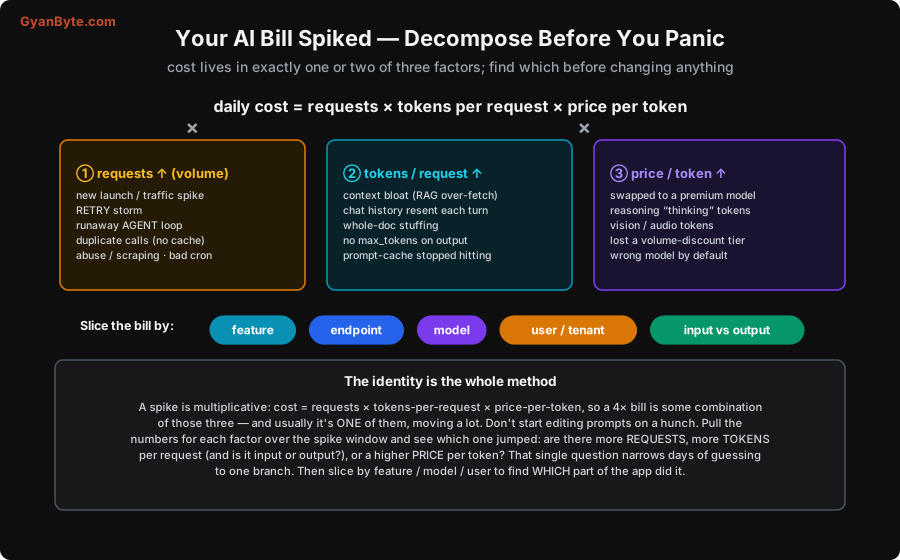
Pull the numbers for each factor over the spike window versus a normal baseline:
- Requests/day — up or flat?
- Average tokens per request — and crucially, split into input vs output tokens (they have different prices and very different causes).
- Price per token — did the effective blended price change (a model swap)?
That single comparison turns “the bill is high, somewhere” into one branch to investigate.
Step 2: Triage — which factor moved?
One question splits the entire search space into four branches you can check in about a minute each.
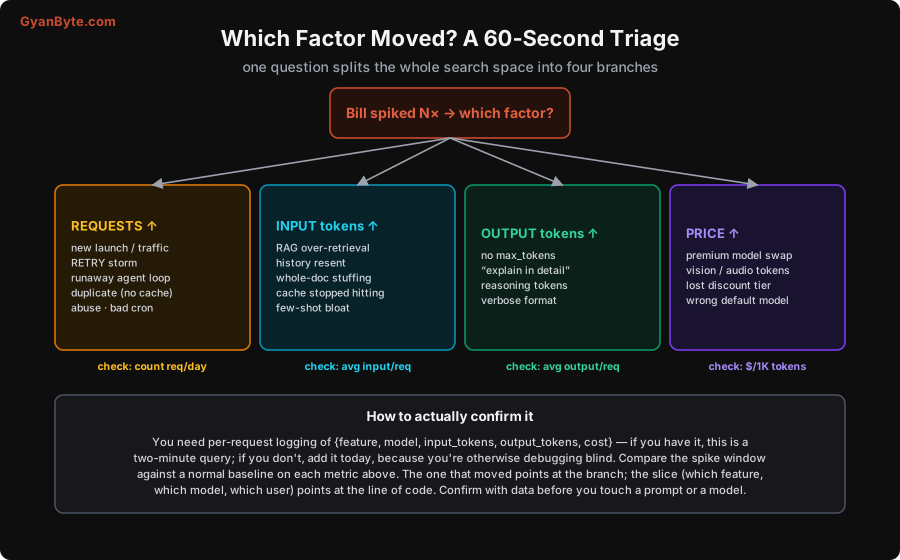
- Requests up, tokens flat → it’s volume. A launch, a traffic spike, a retry storm (an error causing clients to hammer the API), a runaway agent loop (an agent that never decides it’s done), duplicate calls that should’ve been cached, or abuse/scraping. A single misbehaving cron or a deploy that removed a cache can quadruple volume overnight.
- Input tokens up → context bloat. Chat history being resent in full every turn, a RAG step retrieving far too many chunks, “just stuff the whole document in,” ballooning few-shot examples, or — subtle — a prompt cache that stopped hitting because the cached prefix changed, so you’re now paying full price for tokens that used to be ~0.1×.
- Output tokens up → the model is writing more. Missing
max_tokens, a prompt that says “explain your reasoning in detail,” a switch to a reasoning model whose hidden “thinking” tokens you now pay for, or a verbose output format. - Price up, usage flat → someone swapped the model (a frontier model by default), you’re being charged for vision/audio tokens, or you fell out of a volume-discount tier.
To confirm any of this you need per-request logging of {feature, model, input_tokens, output_tokens, cost}. If you have it, this is a two-minute query. If you don’t, add it today — otherwise you’re debugging a cost problem blind, and the next spike will be just as mysterious.
Step 3: Pinpoint the exact culprit
Once you know the branch, slice by feature / model / user to find the exact line of code or config. These are the usual suspects, how they show up, and what to do:
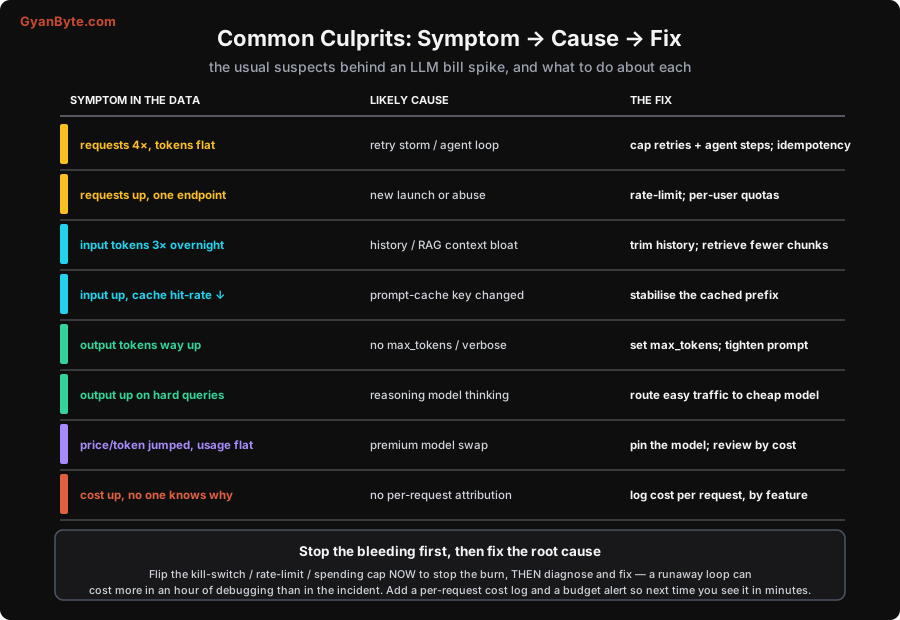
The two that catch almost everyone:
- The retry storm / runaway loop. An error (a timeout, a 429, a bad tool result) triggers a retry; the retry fails too; multiply by every client. Or an agent loops because it never hits a stop condition. Either can burn more money in an hour than you’d expect in a month. Cap retries with backoff, cap agent steps, and make calls idempotent so duplicates are cheap.
- Context bloat. The slowest, most expensive growth is the prompt quietly getting bigger — chat history that’s never truncated, a RAG retriever tuned up from 3 to 20 chunks, a document that grew. Trim aggressively: cap history (summarise older turns), retrieve the fewest chunks that work, and never paste a whole document “to be safe.”
Step 4: Stop the bleeding, then fix the root cause
Order matters in an active incident:
- Stop the burn first. Flip the kill-switch, tighten the rate limit, or drop the provider spend cap now. A runaway loop can cost more during your investigation than it did to trigger it. Degrade the feature gracefully (fall back to a cheaper model or a cached answer) rather than leaving the tap open.
- Then fix the root cause from the table above — the retry cap, the history trim, the
max_tokens, the pinned model, the stabilised cache prefix. - Verify the bill came back down on the same per-request metric that spiked, and keep that metric on a dashboard.
Prevent the next one
Bill spikes should be a monitored event, not an invoice surprise:
- Log cost per request, tagged by feature, model and user — the single highest-leverage thing you can do. Everything above is easy with it and nearly impossible without it.
- Budget alerts on daily spend and on the leading indicators (requests/day, avg tokens/request, cache hit-rate) so you’re paged in minutes, not billed in weeks.
- Hard caps / guardrails:
max_tokenson every call, retry and agent-step limits, per-user quotas and rate limits, and a global kill-switch. - Pin your models and review model changes by their cost impact — a one-line default change is a budget change.
- Cost in CI / evals: track tokens-per-request alongside quality so a prompt change that doubles context fails review, the same way a latency regression would (see AI engineering vocabulary: evals).
This is just observability and FinOps applied to tokens: you can’t manage what you don’t measure.
Takeaways
- A spiked bill is a debugging problem. Decompose with the identity: cost = requests × tokens-per-request × price-per-token — a spike is one or two of those moving.
- Triage the branch: more requests (volume), more tokens (input = context bloat, output = no cap/verbose), or higher price (model swap). Confirm against a baseline.
- The two usual suspects: retry storms / runaway agent loops (volume), and context/history bloat (input tokens).
- Stop the bleeding first (kill-switch, rate-limit, spend cap), then fix the root cause, then verify.
- Prevent it: per-request cost logging by feature/model/user, budget alerts on leading indicators, hard caps (
max_tokens, retry/step limits, quotas), pinned models, and cost in your evals.
Keep it cheap and fast with the AI application performance guide; brush up the terms in the AI engineering vocabulary; and for the monitoring discipline behind all of this, the observability & production debugging course and LLM Engineering in Production.
$ subscribe --weekly
One deep dive a week, in your inbox
System design, AI engineering, trading systems and interview prep. Tested code, real numbers. Free, and you can unsubscribe any time.
or read it on gyanbyte.substack.com


