We finish where performance work actually lives: not in clever tricks, but in understanding where your program spends time and memory, and cutting the waste the profiler points at. Go is a garbage-collected language, so you rarely manage memory by hand — but “garbage-collected” does not mean “allocations are free.” On a hot path, allocations are the thing you tune, and understanding why a value gets allocated is the key skill. As with the rest of the course, this is grounded in numbers I measured.
Stack vs Heap: Escape Analysis
Every value your program creates lives in one of two places, and the difference is enormous for performance.
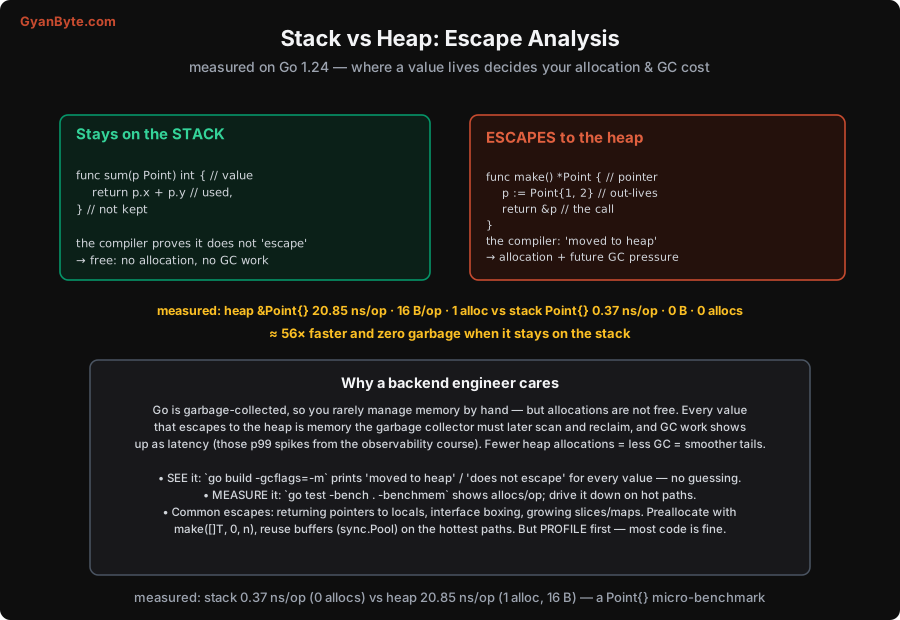
- The stack is a per-goroutine region where local variables live. Allocating on it is essentially free — just bumping a pointer — and it is reclaimed automatically when the function returns. No garbage collector involvement at all.
- The heap is shared memory for values that must outlive the function that created them. Allocating here costs more, and crucially, every heap value is something the garbage collector must later track, scan and reclaim.
Which does a value get? You do not choose explicitly — the Go compiler decides through escape analysis: it proves whether a value can “escape” the function that created it. If the value is only used within the function (like a parameter you read and discard), it stays on the stack. If it escapes — most commonly because you return a pointer to it, store it somewhere longer-lived, or box it in an interface — it is moved to the heap.
I measured the difference with the benchmark harness from Lesson 9:
- A stack-allocated
Point{}(used and discarded): 0.37 ns/op, 0 B/op, 0 allocs/op. - A heap-allocated
&Point{}(pointer returned, so it escapes): 20.85 ns/op, 16 B/op, 1 alloc/op.
That is roughly 56× faster on the stack, with zero garbage produced. The heap version is not “slow” in absolute terms — 20 nanoseconds — but multiply it by millions of operations per second on a hot path and the allocations add up, both in direct cost and in the GC work they create downstream.
Why Allocations Matter: GC and Tail Latency
Here is the chain that makes this a backend concern and not a micro-optimisation curiosity. Every heap allocation is memory the garbage collector must eventually reclaim. Go’s GC is excellent — a concurrent, low-pause collector that does most of its work alongside your program — but it is not free: it uses CPU, and it can introduce small latency as it runs. The more you allocate, the harder and more often the GC works, and that work shows up as latency spikes — precisely the p99 tail that the Observability course taught you to watch. A service that allocates heavily on its hot path has a GC that runs constantly, and its tail latency suffers for it.
So the performance rule for Go backends is: fewer heap allocations = less GC = smoother tail latency. You are not fighting the GC by turning it off (you can’t meaningfully); you are giving it less to do by allocating less on the paths that run millions of times. The two tools make this concrete:
- See escapes with
go build -gcflags=-m(or-gcflags='-m -m'for more detail). The compiler prints, for every value,moved to heap: porp does not escape— no guessing about where your allocations come from. Run it on a hot function and read what escapes. - Measure allocations with
go test -bench . -benchmem(Lesson 9), watching theallocs/opcolumn. Drive it down on the hot path and benchmark before/after to prove the win.
Common sources of escapes to look for: returning pointers to locals (the classic), interface boxing (putting a concrete value into an interface{}/any allocates), growing slices and maps (each reallocation when they outgrow their capacity), and closures that capture variables. The usual fixes: preallocate with capacity (make([]T, 0, n) when you know the size, so append doesn’t repeatedly reallocate), reuse buffers instead of allocating fresh ones per request (a sync.Pool for the very hottest paths), and avoid unnecessary pointer-returning and interface-boxing in inner loops. But note the order of operations in the next section.
GOMAXPROCS, and the Measure-First Discipline
Parallelism is the other performance lever, and it behaves the way Lesson 4’s scheduler predicts. I measured 8 CPU-bound tasks at different GOMAXPROCS settings:
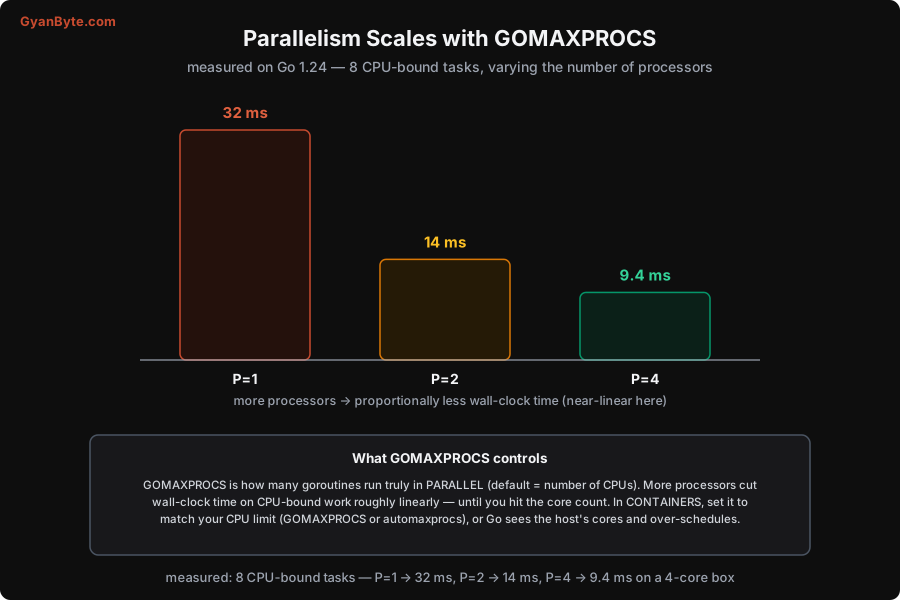
- P=1 → 32 ms, P=2 → 14 ms, P=4 → 9.4 ms. Near-linear scaling: doubling the processors roughly halves the wall-clock time, up to the core count. This is
GOMAXPROCSdoing exactly what Lesson 4 described — it sets how many goroutines run truly in parallel, so CPU-bound work spreads across cores.
The one production gotcha: in containers, set GOMAXPROCS to match your CPU limit. By default Go reads the host’s core count, so a pod limited to 2 CPUs on a 64-core node will set GOMAXPROCS=64 and over-schedule — too many parallel goroutines fighting over 2 real cores, with extra context-switching and GC overhead. Set GOMAXPROCS explicitly to your container’s CPU limit, or use the automaxprocs library to detect it. (Go 1.25 began making the runtime container-aware here, but setting it explicitly is still the safe habit.)
Now the most important point in the whole lesson, and a fitting close to the course: measure first. Everything above — escape analysis, allocation cutting, sync.Pool, GOMAXPROCS tuning — is worth doing only on code that is actually hot, and you do not know what is hot until you profile (Lesson 9: pprof, flame graphs, under real load). The overwhelming majority of your code is not on a hot path and should be written for clarity, not speed — a heap allocation in a request that happens a hundred times a second is completely irrelevant. Optimising code the profiler never flags is wasted effort that makes the codebase harder to read for no benefit (and clear code, per the whole course, is the real long-term win).
The discipline, then: write clear, simple Go (Lessons 1–11); when something is slow, profile it under real load; find the genuine hot path; and there — and only there — reach for escape analysis and allocation reduction, benchmarking each change. That is how you get a fast Go service: not by premature cleverness everywhere, but by measuring, finding the few places that matter, and cutting the allocations the numbers point to. Simple by default, fast where it counts — the Go way, start to finish.
Pitfalls to Avoid
- Optimising without profiling. Rewriting code you assume is hot wastes effort and harms readability. Profile under real load (pprof, Lesson 9), find the actual hot path, optimise that. Measure before and after.
- Allocating heavily on the hot path. Returning pointers, boxing into interfaces, and re-growing slices in an inner loop create garbage that makes the GC run constantly and spikes p99. Check
allocs/opand-gcflags=-m; preallocate and reuse on hot paths. - Micro-optimising cold code. Shaving allocations from code that runs a hundred times a second buys nothing and costs clarity. Only the hot path earns the extra complexity; everywhere else, write for the reader.
- Reaching for
sync.Pooleverywhere. Pooling adds complexity and its own bugs; it pays off only on genuinely hot allocation paths. Prove the win with a benchmark before introducing it. - Leaving
GOMAXPROCSat the host default in containers. A 2-CPU pod on a big node over-schedules withGOMAXPROCS=64. Set it to the container’s CPU limit (or useautomaxprocs). - Trying to “turn off” or fight the GC. You give the GC less work by allocating less, not by disabling it.
GOGCtuning is a last resort for specific workloads; the real lever is fewer heap allocations on hot paths. - Believing the stack/heap choice is yours to make directly. You don’t place values explicitly — escape analysis does, based on whether a value escapes. Influence it by not making values escape unnecessarily (avoid needless pointer-returns and interface boxing in hot code), and verify with
-gcflags=-m.
Quick Recap
- Go is garbage-collected, but allocations aren’t free. Escape analysis decides where a value lives: proved not to outlive the function → stack (free); escapes (returned pointer, interface boxing) → heap (allocation + GC). Measured: stack
Point{}0.37 ns/0 allocs vs heap&Point{}20.85 ns/16 B/1 alloc ≈ 56× faster, zero garbage. - Allocations drive GC, and GC shows up as tail latency. Fewer heap allocations = less GC = smoother p99. See escapes with
go build -gcflags=-m; measure them withgo test -bench -benchmem(allocs/op). Fix with preallocation (make([]T,0,n)), buffer reuse (sync.Poolon the hottest paths), less boxing. GOMAXPROCSscales CPU-bound work near-linearly (measured: P=1 32 ms → P=2 14 ms → P=4 9.4 ms). In containers, set it to your CPU limit (or useautomaxprocs) so Go doesn’t over-schedule on the host’s cores.- Measure first, always. Most code should be written for clarity, not speed; profile under real load, optimise only the genuine hot path, benchmark each change. Simple by default, fast where it counts.
That’s the course. You now have Go the way backend engineers actually use it: why its boring-on-purpose design pays off, errors as values and the idioms that make code read like Go, implicit interfaces and composition, the goroutine-and-scheduler model that runs a million concurrent tasks for next to nothing, channels and the concurrency patterns built on them, safe shared state and the race detector, a complete HTTP service on the standard library, the built-in testing and profiling toolchain, the database pool, a production-ready deployment, and the performance discipline to make it fast where it counts — every big claim grounded in a real measurement. Go build something, run go test -race, profile it under load, and keep it simple. Happy shipping.