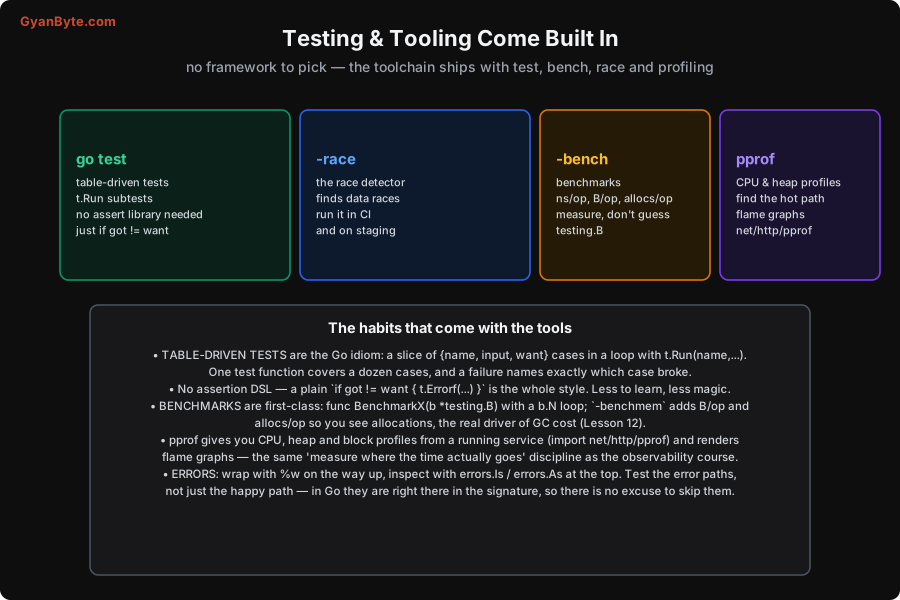
Go folds the tools you would otherwise assemble from third-party libraries — a test framework, a benchmark harness, a profiler, a formatter, a race detector — into the standard toolchain. There is nothing to choose and little to configure; go test does it all. This lesson is how to use that toolchain to make a service correct and fast, and the error-handling habits that a well-tested Go codebase shows.
Testing: Table-Driven, No Framework
You do not pick a testing framework in Go. Tests are functions named TestXxx(t *testing.T) in _test.go files, run with go test ./.... And the idiomatic style is table-driven: express your cases as a slice of structs and loop over them.
func TestDiscount(t *testing.T) {
    cases := []struct {
        name string
        in   int
        want int
    }{
        {"no discount below 100", 50, 50},
        {"ten percent at 100", 100, 90},
        {"ten percent above", 200, 180},
    }
    for _, c := range cases {
        t.Run(c.name, func(t *testing.T) {
            got := Discount(c.in)
            if got != c.want {
                t.Errorf("Discount(%d) = %d, want %d", c.in, got, c.want)
            }
        })
    }
}
One test function covers a dozen cases; t.Run(c.name, ...) makes each a named subtest, so a failure tells you exactly which case broke and you can run one with go test -run TestDiscount/ten_percent. Notice there is no assertion library — no assert.Equal, no expect(...).toBe(...). The whole style is a plain if got != want { t.Errorf(...) }. This is deliberate (the Lesson 1 simplicity): less magic, a clear failure message you control, nothing to learn. Many teams add testify for convenience assertions, but you never need it, and the standard style is what you’ll read in the standard library itself.
A few more testing tools worth knowing: t.Helper() marks a helper so failures point at the caller; t.Parallel() runs tests concurrently; testing/fstest and httptest give you in-memory file systems and HTTP servers for fast, hermetic tests; and the interfaces from Lesson 3 are what make your code testable — pass a fake Store (a map-backed struct) instead of a real database, no mocking framework required.
And always wire the race detector (Lesson 7) into your test run: go test -race ./... in CI catches the concurrency bugs that plain tests miss. Make it non-negotiable for a concurrent service.
Benchmarks: Measure, Don’t Guess
Benchmarks are first-class in the same toolchain. A BenchmarkXxx(b *testing.B) function runs its body b.N times, and the framework finds b.N automatically to get a stable measurement:
func BenchmarkEncode(b *testing.B) {
    o := sampleOrder()
    b.ReportAllocs()
    for i := 0; i < b.N; i++ {
        _, _ = json.Marshal(o)
    }
}
Run with go test -bench . -benchmem and you get output like:
BenchmarkEncode-8 1724376 695 ns/op 248 B/op 3 allocs/opThree numbers that matter: ns/op (time per operation), B/op (bytes allocated per operation), and allocs/op (number of heap allocations per operation). That last pair is the key to performance in Go, because allocations drive garbage-collection cost (Lesson 12) — the measurements throughout this course (mutex 88.5 ns/op, atomic 32.6 ns/op, stack 0.37 ns vs heap 20.85 ns) all come from exactly this harness. The discipline it enforces is the important part: measure, don’t guess. When someone claims “this is faster,” ask for the benchmark. When you optimise, benchmark before and after. Go makes this so easy that there is no excuse not to.
Profiling: pprof and Flame Graphs
Benchmarks tell you a function is slow; pprof tells you where in a running service the time and memory actually go. You expose it by importing one package:
import _ "net/http/pprof" // registers /debug/pprof/ handlers on the default muxThen you capture a CPU profile (go tool pprof http://localhost:8080/debug/pprof/profile?seconds=30), a heap profile (.../heap), or a goroutine dump (.../goroutine — invaluable for finding leaked goroutines from Lesson 4), and render it as a flame graph where width is time or memory spent. The widest box is your hot path — optimise that, not the function you assume is slow. (If you took the Observability course, this is exactly the “flame graphs find the hot code, profile in production” discipline — Go builds it into the standard library.) The key habit: profile under real load before optimising, because the hot path with production data and concurrency is routinely different from what you’d guess on your laptop.
Round it out with the rest of the built-in toolchain you’ll use daily: go vet (catches suspicious constructs — a copied mutex, a bad Printf verb), gofmt/goimports (formatting is not a debate), go test -cover (coverage), and go build -race for a staging binary. One toolchain, no assembly required.
The Error Discipline in a Real Codebase
Pulling Lesson 2 forward into a tested service: errors are values, so test the error paths, not just the happy path. Because the error is right there in the signature (func Get(ctx, id) (Order, error)), there is no excuse to skip it — add table cases for “not found,” “timeout,” “bad input,” and assert both the behaviour and, where it matters, the specific error (errors.Is(err, ErrNotFound)). In the code itself, keep the two-part discipline: wrap with %w on the way up to build a context trail, and inspect with errors.Is/errors.As at the top (your HTTP handler) to map an error to the right status code — ErrNotFound → 404, a validation error → 400, anything else → 500 and a logged stack. A well-tested Go service has as many tests for its failure modes as for its successes, and the explicit-error design is what makes that natural rather than an afterthought.
Pitfalls to Avoid
- Reaching for an assertion framework reflexively. You don’t need
testifyor any DSL;if got != want { t.Errorf(...) }with table-driven cases is the idiom. Adding a framework is fine for convenience but never required — don’t treat it as mandatory. - Not using subtests. One big test with ten un-named checks gives a useless failure (“something failed”). Use
t.Run(name, ...)so a failure names the exact case and you can run it in isolation. - Benchmarking without
-benchmem. Timing alone hides the real cost — allocations. Callb.ReportAllocs()/ pass-benchmemand watchallocs/op; that’s what drives GC (Lesson 12). - Micro-optimising from a guess, not a profile. Rewriting the function you think is hot wastes effort. Profile with pprof under real load, read the flame graph, optimise the widest box. Measure before and after.
- Testing only the happy path. In Go the error is in every signature; skipping error-path tests leaves your failure handling unverified. Add cases for not-found/timeout/bad-input and assert the specific error with
errors.Is. - Forgetting
-racein CI. Tests that pass without-racecan still harbour data races. Rungo test -race ./...in CI for any concurrent code — it’s the cheapest insurance you’ll ever buy (Lesson 7).
Quick Recap
- Go’s toolchain is built in — no framework to pick.
go testruns table-driven tests: a slice of{name, input, want}witht.Run(name, ...)subtests, and a plainif got != want { t.Errorf(...) }— no assertion DSL. Interfaces (Lesson 3) make fakes trivial. go test -race(Lesson 7) belongs in CI. Benchmarks are first-class:BenchmarkX(b *testing.B)with-benchmemreports ns/op, B/op, allocs/op — allocations drive GC cost, so measure them.- pprof (
import _ "net/http/pprof") gives CPU/heap/goroutine profiles and flame graphs from a running service — profile under real load, optimise the widest box, don’t guess. - Error discipline: wrap with
%wgoing up, inspect witherrors.Is/Asat the top (map to HTTP status), and test the error paths — they’re in every signature, so there’s no excuse.
Next lesson: talking to a database the Go way — database/sql, and the connection pool that bites everyone exactly once.