Here’s a question I like to ask in interviews: “A customer says checkout took 10 seconds. You have 15 microservices. Where do you start?”
Most people start with logs: grep the order service logs for that customer, then the payment service, then the gateway… and try to line up timestamps from different machines. We know from Lesson 3 how reliable that is. After 40 minutes, they have a theory.
With proper observability, the answer is: search for the request in the tracing tool, open the trace, and look at the longest bar. Two minutes.
This last lesson covers how to set that up, then brings the whole course together in one design and one incident walkthrough.
Three Views, One Trace ID
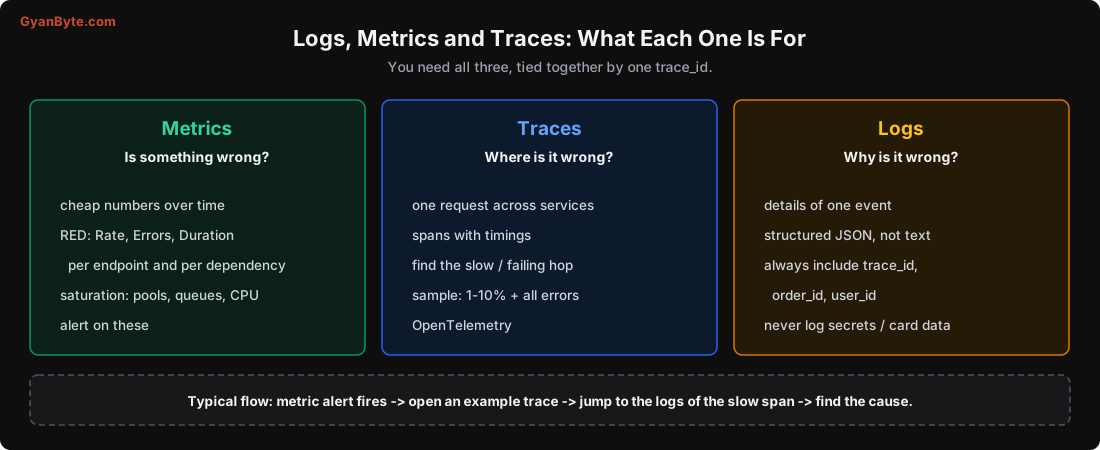
Metrics: is something wrong?
Metrics are numbers over time: cheap to collect, cheap to store, and the right thing to alert on. For every service, track RED:
- Rate: requests per second.
- Errors: failed requests per second (or error ratio).
- Duration: latency, as percentiles (p50, p99, p99.9), never just the average (Lesson 1).
The distributed-systems twist: track RED per dependency, from the caller’s side. “Order service → payment service: 45 req/s, 2% errors, p99 1,200 ms.” That’s how you see that the problem is the call to payments, even before you look at the payment service itself. Most HTTP and gRPC client libraries can emit this automatically.
Also track saturation: thread pool usage, connection pool usage, queue depth, consumer lag (Lesson 9), circuit breaker state (Lesson 11). Saturation is what tells you a cascade is starting.
Traces: where is it wrong?
A trace follows one request through every service it touches. Each unit of work is a span, with a start time, a duration, a parent, and attributes. All spans of one request share a trace ID, which is passed from service to service in a header (traceparent, from the W3C Trace Context standard).
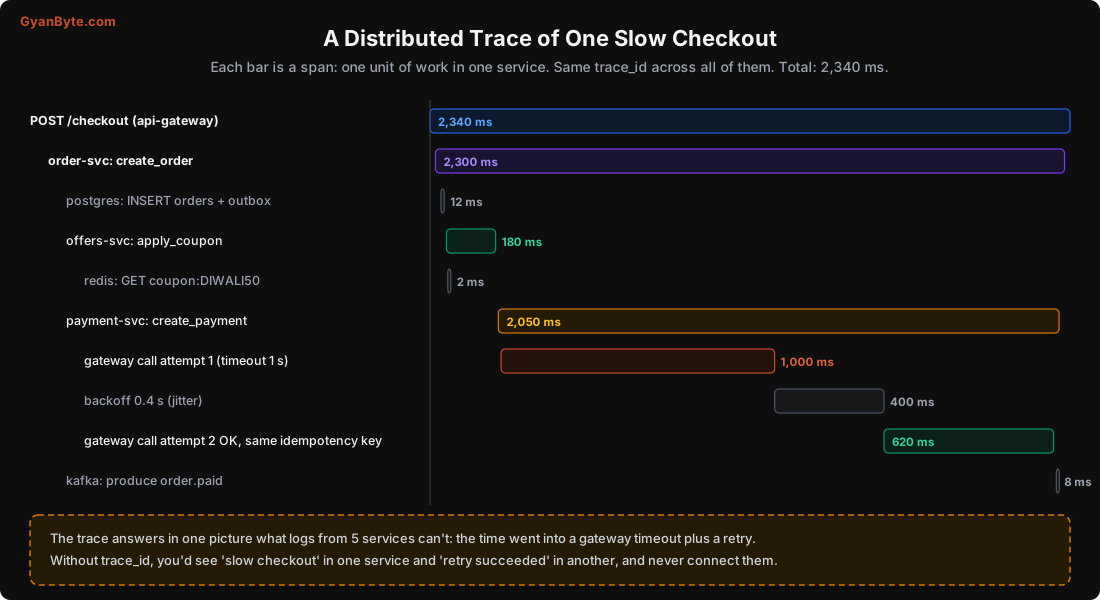
This trace (an illustrative example, shaped like ones I’ve debugged) answers the “10-second checkout” question instantly: the time went into the payment gateway. The first attempt timed out at 1 second, the client backed off for 400 ms with jitter, and the second attempt, with the same idempotency key (Lesson 2), succeeded. No double charge, just a slow gateway. Without the trace, you’d see “slow request” in the gateway logs, “retry succeeded” in the payment logs, and possibly never connect the two.
OpenTelemetry is the standard way to do this today. It has SDKs for every major language, auto-instrumentation for common frameworks (HTTP servers and clients, database drivers, Kafka clients), and it can send data to Jaeger, Grafana Tempo, Zipkin, Datadog, New Relic, Honeycomb or any other backend. Adding a custom span is a few lines:
from opentelemetry import trace

tracer = trace.get_tracer("payment-service")

def create_payment(order_id, amount_paise, idem_key):
    with tracer.start_as_current_span("create_payment") as span:
        span.set_attribute("order.id", order_id)
        span.set_attribute("payment.amount_paise", amount_paise)
        span.set_attribute("payment.idempotency_key", idem_key)
        return call_gateway(order_id, amount_paise, idem_key)
Practical notes:
- Propagate context across async boundaries too. Put the trace context in Kafka message headers, so the consumer’s spans join the producer’s trace. OpenTelemetry’s Kafka instrumentation does this.
- Sample wisely. Tracing every request at high volume is expensive. Keep 1-10% of normal requests, plus all errors and slow requests (tail-based sampling, which decides after the request finishes).
- Put business IDs on spans: order ID, payment ID, user ID (not personal data). Then support can find the trace for a complaint.
Logs: why is it wrong?
Logs give the details: the exact error, the input that caused it, the decision the code made. In a distributed system, two habits make logs useful:
- Structured logs (JSON), not free text, so you can filter by fields.
- Every log line carries the trace ID (and span ID), plus the business IDs. Then from any span in a trace, you can jump to exactly the logs written during it.
{"ts": "2026-10-27T19:42:07.311Z", "level": "warn", "service": "payment-svc",
 "trace_id": "4bf92f3577b34da6a3ce929d0e0e4736", "order_id": "81",
 "msg": "gateway timeout, will retry", "attempt": 1, "timeout_ms": 1000}
And one rule that’s easy to forget under pressure: never log secrets, tokens, full card numbers, CVVs or Aadhaar numbers. Logs are copied to many places and kept for a long time.
Capstone: Designing Order Placement
Let’s put the whole course together. The system: order placement for Tiffin Express, our imaginary food delivery app. A user taps “Place order and pay”. We need to create the order, apply coupons, take payment, tell the restaurant, assign a rider, and notify the user. All of this across services, at sale-day traffic, without double charges, lost orders or duplicate riders.
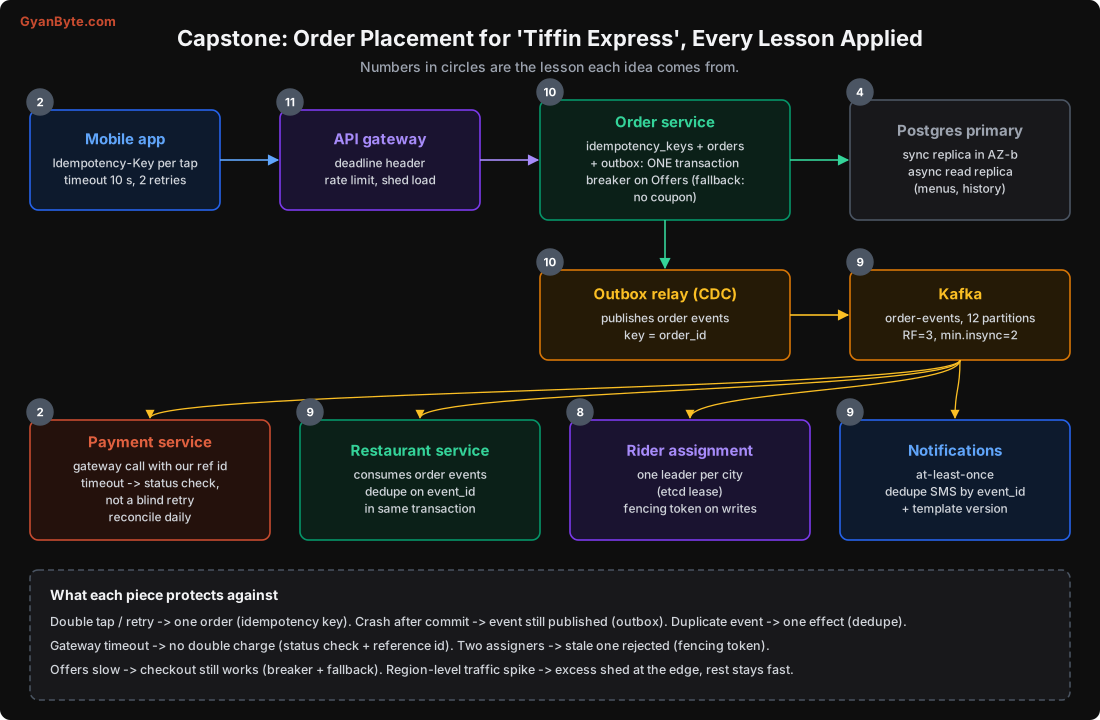
Walking through it, with the lesson each decision comes from:
The tap (Lesson 2). The app generates an idempotency key when the user taps “Place order”, and reuses it for every retry of that tap. The app’s timeout is generous (10 s) because a slow success is better than a confused user, and it retries at most twice. If the final answer is still unknown, the app shows “We’re confirming your order” and polls the order status, instead of showing an error.
The gateway (Lessons 2 and 11). The API gateway sets a deadline for the whole request and passes it down in a header. It enforces per-user rate limits, and under overload, sheds low-priority traffic (recommendations, browsing) before checkout.
The order service (Lessons 2, 3, 10, 11). In one Postgres transaction, it inserts the idempotency key, the order (status PAYMENT_PENDING), and an order_placed row in the outbox. A repeat of the same key returns the saved response. Order status changes use a version column with compare-and-set, not timestamps. The call to the offers service has a 300 ms timeout and a circuit breaker; the fallback is “no coupon applied”, clearly shown to the user.
The database (Lesson 4). A Postgres primary with one synchronous replica in another availability zone (no data loss on failover), managed by a consensus-backed failover tool. An asynchronous read replica serves menus and order history, but the order status page right after checkout reads from the primary (read-your-writes).
Events (Lessons 9 and 10). A CDC relay publishes outbox rows to Kafka, keyed by order_id, so all events for an order are in one partition, in order. Kafka has replication factor 3 and min.insync.replicas=2. Every consumer deduplicates by event_id in the same transaction as its side effects.
Payment (Lessons 2 and 10). The payment service calls the gateway with the order ID as the merchant reference (the gateway’s idempotency). On timeout, it doesn’t retry the charge. It calls the gateway’s status API with backoff. Payments still PENDING after 30 minutes go to a reconciliation job, which also compares the daily settlement file against orders.
The order saga (Lesson 10). Payment success moves the order to PAID and triggers the restaurant. If the restaurant rejects the order (closed, item out of stock), the compensation is a refund, then cancellation. The SMS “Your order is confirmed” is sent only after the restaurant accepts, because it can’t be undone.
Rider assignment (Lessons 6, 7, 8). Assignment for each city is done by one leader, elected through an etcd lease. Writes to the assignment table carry the lease’s revision as a fencing token, checked with WHERE fence_token < :token, so a paused ex-leader can’t assign a second rider. Cities are the partitioning unit for this service; the two biggest metros get their own instances because they’re hot keys.
Notifications (Lesson 9). At-least-once, deduplicated by event ID, with a dead-letter queue for messages that fail repeatedly (an invalid phone number shouldn’t block the partition).
Observability (this lesson). OpenTelemetry everywhere, trace context in Kafka headers, RED metrics per dependency, alerts on checkout error rate, p99 latency, consumer lag in time, outbox age, and circuit breaker state.
Is this over-engineered for a startup with 100 orders a day? Yes. Start with a monolith and one database, where most of this collapses into ordinary transactions. But every piece here earns its place once you have several services, real money, and sale-day traffic, and it’s much cheaper to know where you’re going before you get there.
Capstone Incident: “Orders Stuck in Payment Pending”
Now let’s debug something. This walkthrough is illustrative, but every step uses behaviour we measured in this course.
19:42 - Alert. The checkout success rate drops from 98% to 91%. The p99 of POST /checkout goes from 1.2 s to 6 s. Support reports users seeing “We’re confirming your order” for a long time.
Step 1: Metrics, per dependency. The order service’s RED metrics are fine for the database and Kafka. The payment service’s metrics for calls to the payment gateway show p99 jumping from 600 ms to over 1 s, with a 30% timeout rate. Not our bug, then? Don’t conclude yet.
Step 2: A trace. Opening a slow trace shows exactly the waterfall above: attempt 1 times out at 1 s, backoff, attempt 2 succeeds. Users are slow but getting through. So why is the success rate down?
Step 3: A failed trace. Filtering traces by error shows a different shape: the payment service makes four attempts, then gives up, and the order goes to PAYMENT_PENDING. The logs on those spans (found by trace ID) show the retry count is 3 at the payment service and the order service retries the whole payment call twice. That’s retries at two layers: up to 12 gateway calls per checkout during a gateway slowdown (Lesson 2). The gateway’s dashboard, when we check it, shows it started rate-limiting us at 19:43, a minute after the slowdown began. We were making the slowdown worse.
Step 4: Contain. Turn off the order service’s retry (feature flag), leaving one retry layer. Lower the payment client’s retries to 1 and add a retry budget. Within two minutes, the gateway stops rate-limiting us and the success rate recovers to 96% (the gateway itself is still slow).
Step 5: Clean up. Around 1,800 orders are in PAYMENT_PENDING. Are they paid? We don’t guess (Lesson 2). The reconciliation job asks the gateway for the status of each, by our order ID as reference: 1,640 were actually paid (the timeouts were “unknown”, not “failed”), 160 were not. Paid ones move forward; unpaid ones are cancelled with a notification. No double charges, because every retry used the same reference ID.
Step 6: Follow-ups.
- Remove retries from the order service permanently. Retry in one layer only.
- Add a retry budget and a circuit breaker on the gateway client, with the fallback “payment pending, we’ll confirm shortly”.
- Add an alert on the gateway’s 429 rate, not just its latency.
- Add a dashboard panel: count of orders in
PAYMENT_PENDINGolder than 5 minutes.
Notice how much the good parts of the design helped: idempotent payment references meant no double charges, the status-check pattern meant 1,640 orders were saved instead of cancelled, and traces made the double-retry visible in minutes. The bad part, retries in two layers, is the most common mistake in the whole course.
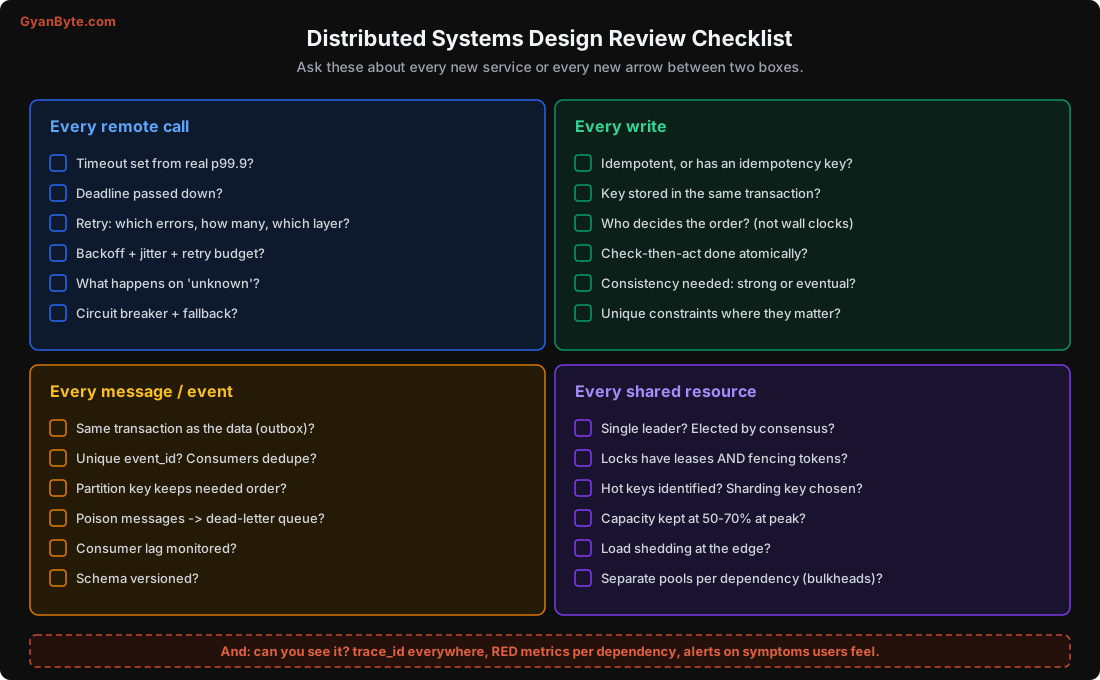
The Design Review Checklist
Here’s everything from the course as questions to ask about any design. I use a version of this for every design review:
Pitfalls to Avoid
- Debugging by grepping logs on many machines and lining up timestamps. Use trace IDs.
- Averages on dashboards. Use p99 and p99.9.
- Metrics only from the server’s side. Measure each dependency from the caller’s side too.
- Trace context lost at queues. Put it in message headers.
- Alerting on causes (CPU high) instead of symptoms (checkout failing). Alert on what users feel; use causes for diagnosis.
- Logging secrets or personal data.
- Assuming “timed out” means “failed” during cleanup. Ask the downstream system.
- Building the full capstone design on day one. Grow into it as services and traffic grow.
Quick Recap
- Metrics tell you something is wrong, traces tell you where, logs tell you why. Tie them together with one trace ID.
- Track RED per endpoint and per dependency, plus saturation. Use OpenTelemetry and propagate context through queues.
- The capstone combined idempotency keys, deadlines, load shedding, outbox, keyed events, dedupe, status checks, consensus-based leadership with fencing tokens, and circuit breakers.
- The capstone incident was retries in two layers making a slow gateway slower; status checks recovered 1,640 “pending” orders that had actually been paid.
Course Wrap-Up
If I had to boil this course down to a few lines to stick on your monitor:
- A remote call has three outcomes: success, failure, and unknown. Design for unknown.
- Everything will be retried, so everything must be idempotent.
- Don’t trust clocks to order events across machines. Let one place decide the order.
- Every copy of data is a little behind, unless you pay for coordination on every request.
- Majorities, leases and fencing tokens are how machines agree safely. Use etcd, ZooKeeper or your database; don’t invent your own.
- Two writes to two systems are never atomic. Use an outbox, and deduplicate on the other side.
- Slow is worse than down. Timeouts, budgets, breakers, bulkheads and shedding keep slowness from spreading.
- Break things on purpose, the way we did in every lesson, before production does it for you.
Thank you for working through the whole course. Set up the lab from Lesson 1, rerun the experiments, change the numbers, and see what breaks. That’s how this material stops being theory.