The worst outage I was ever part of started with a single missing index.
A new feature added a query to the coupon service. In testing, with a small table, it took 30 ms. In production, on a big table at peak traffic, it took 3 seconds. The offers service called the coupon service with no timeout set. Its threads filled up waiting. The order service called the offers service, also without a sensible timeout, and its threads filled up too. Kubernetes saw the order pods failing health checks (the health check endpoint couldn’t get a thread either) and restarted them, which made things worse. Within about 90 seconds, the API gateway’s workers were all stuck waiting, and even the login page failed. A query in a service most people had never heard of had taken down the entire app.
Nothing had crashed. Nothing was “down”. One thing got slow, and the slowness spread. This lesson is about why that happens and how to stop it.
Latency Explodes Near Full Load
First, some intuition from queueing theory, because it explains why systems fall off a cliff instead of degrading gently.
Imagine a single server handling requests that take 10 ms each on average, arriving at random times. When it’s 50% busy, a new request usually finds the server free. When it’s 90% busy, a new request often finds a queue in front of it. And because arrivals are random, sometimes many arrive together, and the queue gets long.
I simulated this: one server, random arrivals, average service time 10 ms, 2 lakh requests at each load level:
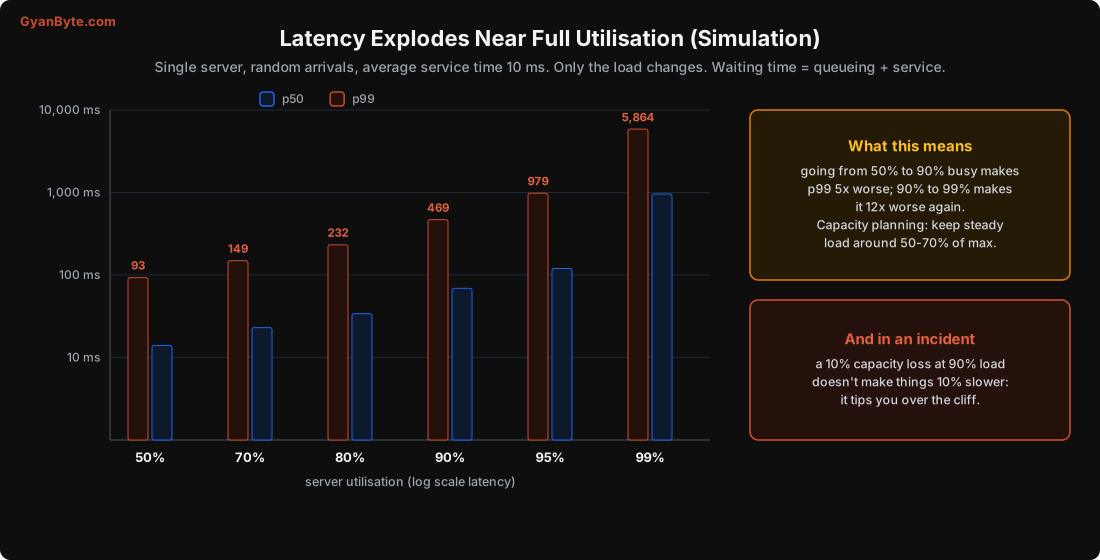
util 50%: p50   14 ms   p99    93 ms
util 70%: p50   23 ms   p99   149 ms
util 80%: p50   34 ms   p99   232 ms
util 90%: p50   69 ms   p99   469 ms
util 95%: p50  120 ms   p99   979 ms
util 99%: p50  958 ms   p99 5,864 ms
The same server, the same work. Going from 50% to 90% busy made the p99 5 times worse. Going from 90% to 99% made it 12 times worse again.
Two practical consequences:
- Plan capacity for 50-70% utilisation at peak, not 90%. The “wasted” headroom is what keeps latency stable.
- A small loss of capacity at high load is a big deal. If you’re at 90% and lose one of ten servers (or a GC pause, or a slow disk takes 10% of capacity), you’re suddenly at 100%, and the queue grows without limit.
Retry Storms and Metastable Failure
Now add retries. In Lesson 2, I warned that jitter spreads retries out but doesn’t reduce them. Here’s the full story.
I simulated a service with capacity for 1,000 requests per second, receiving a steady 800 per second. Comfortable: 80% utilisation. Then, from t = 10 s to t = 15 s, capacity dropped to 400 per second (a GC storm, a slow disk, a noisy neighbour). Clients had a 1-second timeout and up to 3 retries. I compared four client and server behaviours:
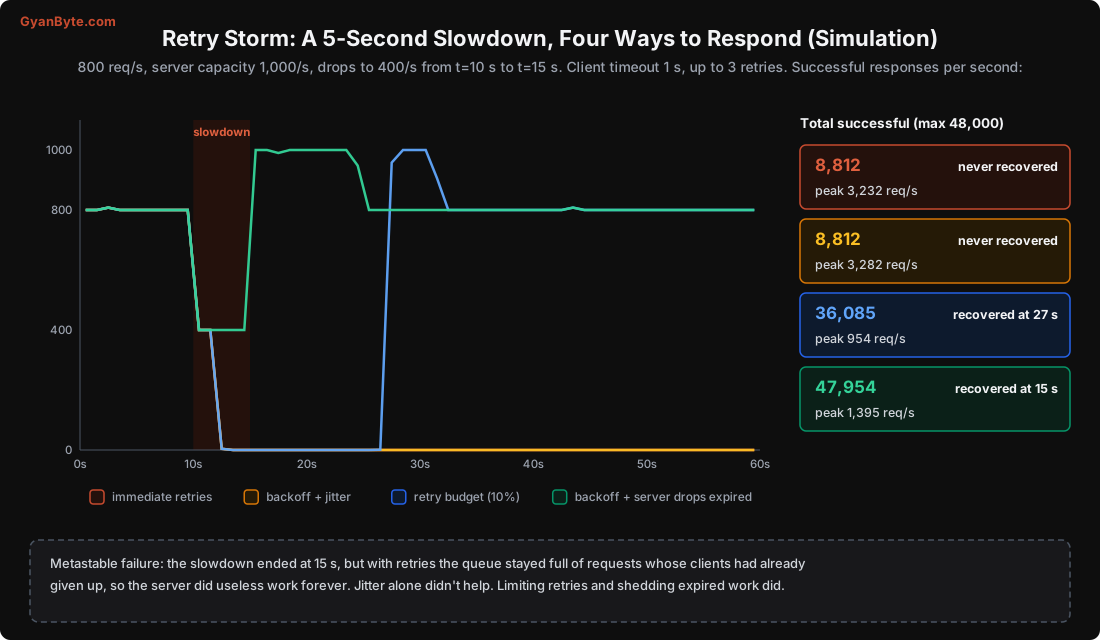
immediate     recovered: never     peak offered 3,232/s   total successful  8,812
backoff       recovered: never     peak offered 3,282/s   total successful  8,812
budget        recovered at 27 s    peak offered   954/s   total successful 36,085
backoff+shed  recovered at 15 s    peak offered 1,395/s   total successful 47,954   (max possible 48,000)
What happened with immediate retries (and, surprisingly to many people, with backoff + jitter too):
- During the slowdown, the queue grew. Requests waited more than 1 second, so clients timed out.
- Each timeout produced a retry. Now the server had the original traffic plus retries: up to 4x the load.
- The server kept processing requests from the front of its queue, but those clients had already given up. Every response it produced went to nobody. Useful throughput dropped to zero.
- At t = 15 s, capacity came back to 1,000/s. But the offered load was now over 3,000/s, so the queue never drained. The system stayed down even though the original cause was gone.
This is called a metastable failure: the system has two stable states, healthy and overloaded, and a temporary trigger can knock it from one to the other, where it stays. It’s how a 5-second blip becomes a 2-hour outage that only ends when someone restarts everything or blocks traffic.
What fixed it:
- A retry budget (retries allowed only up to 10% of normal request volume) kept the extra load small. The system recovered at 27 s.
- Shedding expired work on the server: if a request’s deadline has already passed (the client sent it in a header, Lesson 2), don’t process it, drop it immediately. The server only spends capacity on requests someone is still waiting for. With that, even with backoff retries, the system recovered the moment capacity came back, and served 47,954 of a possible 48,000 requests.
That last result is my favourite in this course. The most effective protection wasn’t on the client at all. It was the server refusing to do work nobody wanted.
Retry budgets in practice
A retry budget means: retries may add at most X% (often 10-20%) on top of normal traffic. Implementations:
- gRPC’s retry throttling (a token bucket that empties when requests fail).
- Envoy / Istio:
retry_budgetwith a percentage of active requests. - Finagle and Linkerd have retry budgets built in.
- In your own client: a token bucket that gains 0.1 tokens per successful request and spends 1 per retry, like my simulation.
How Failures Cascade
Back to my outage. Here’s the anatomy:
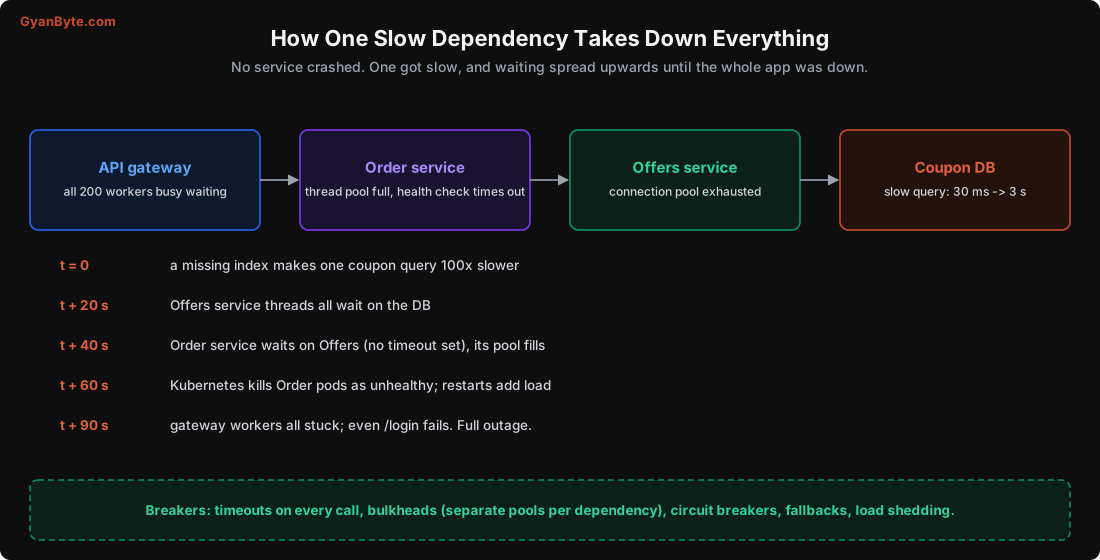
The general pattern:
- A dependency gets slow (not down; slow is worse, because fast failures free resources, slow ones hold them).
- Callers wait. Their threads, connections or memory fill up with waiting requests.
- Now the callers are slow too, for all their requests, including ones that don’t touch the slow dependency.
- Their callers wait on them, and so on, up the chain.
- Health checks fail because they can’t get a thread, so orchestrators restart pods, which drops in-flight work and adds startup load.
The fixes are a set of patterns that each break one link in this chain.
The Resilience Toolkit
1. Timeouts and deadlines on every call
The first and most important. With a 300 ms timeout on the coupon call, the offers service would have failed those calls fast and kept its threads free. Everything in Lesson 2 applies: set timeouts from real latency, and pass deadlines down.
2. Circuit breakers
A circuit breaker wraps calls to one dependency and watches the results:
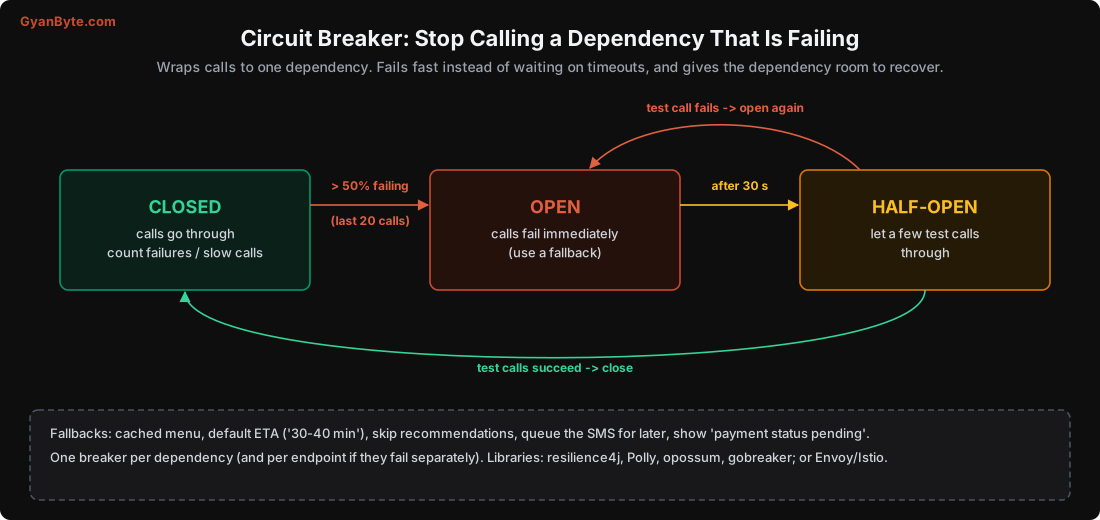
- Closed (normal): calls go through. The breaker counts failures and slow calls.
- Open: once failures cross a threshold (say 50% of the last 20 calls), stop calling the dependency at all. Fail immediately and use a fallback.
- Half-open: after a cool-down, let a few test calls through. If they succeed, close the breaker; if not, open it again.
The breaker does two things: it protects you (no threads wasted waiting on a dependency that’s failing), and it protects the dependency (no traffic while it’s trying to recover, which also helps against the metastable trap above).
The breaker is only as good as its fallback. Decide in advance what the user sees when each dependency is unavailable:
- Coupon service down → checkout without coupons, with a message “Offers unavailable right now”.
- Recommendations down → show the popular items list from cache.
- ETA service down → show “30-40 min” based on the restaurant’s average.
- Payment status unknown → “Payment processing, we’ll notify you”, and reconcile (Lesson 10).
3. Bulkheads
Ships have watertight compartments so one leak doesn’t sink the ship. In software, bulkheads mean separate resource pools per dependency: a separate thread pool or connection pool (or a concurrency limit) for calls to coupons, to payments, to recommendations.
If the coupon service gets slow, it can only exhaust the 20 threads reserved for coupon calls. Payments and everything else keep their own threads. In my outage, a bulkhead in the offers service would have kept the order flow alive with coupons disabled.
4. Load shedding
When a service is overloaded, it’s better to reject some requests quickly than to accept all of them and serve none well. Ways to shed:
- Concurrency limits: accept at most N requests in flight; reject the rest with 503 immediately. Adaptive limiters (like Netflix’s concurrency-limits library) adjust N based on observed latency.
- Deadline-aware dropping: as in the simulation, skip requests whose deadline has passed or can’t be met.
- Priority: under pressure, keep checkout and payment, shed recommendations and analytics. Tag requests with a priority at the edge.
- At the edge: rate limits at the API gateway or load balancer, so excess traffic never reaches the services at all.
A rejected request costs microseconds. An accepted request that times out after 10 seconds costs a thread for 10 seconds, plus a retry.
5. Backpressure
In pipelines (queues, streams, async processing), backpressure means a slow consumer signals upstream to slow down, instead of letting work pile up without limit. Bounded queues are the simplest form: when the queue is full, producers block or get an error, instead of the queue eating all memory. Unbounded in-memory queues are a common hidden cause of out-of-memory crashes during incidents.
6. Graceful degradation and capacity headroom
Design the product to work in degraded modes: read-only mode when the primary database is struggling, cached pages when the backend is slow, disabling expensive features during a sale. And keep the headroom from the queueing section: a system running at 50-70% has room to absorb a bad minute.
Testing It: Chaos Before Customers
None of this is worth much until you’ve seen it work. Practical ways to test, starting small:
- In a staging environment, inject latency into one dependency (Toxiproxy, a service mesh fault-injection rule, or a simple sleep behind a feature flag) and watch what happens upstream. Do breakers open? Do fallbacks show? Do thread pools stay healthy?
- Load test past your expected peak, and watch for the cliff: where does p99 start rising sharply?
- Game days: during working hours, with everyone watching, kill a node or slow a dependency in production, deliberately. Netflix’s Chaos Monkey made this famous; you don’t need to start at that scale.
Every experiment in this course, from killing the etcd leader to pausing a lock holder, is a small version of this. Breaking things on purpose is how you learn how they really behave.
Pitfalls to Avoid
- Running hot. At 90% utilisation, small disturbances cause huge latency spikes.
- Unlimited retries, at every layer. Retries turned a 5-second slowdown into a permanent outage in the simulation.
- Believing jitter solves retry storms. It spreads load; it doesn’t reduce it. Use retry budgets.
- Processing requests whose clients have given up. Pass deadlines and drop expired work.
- No timeouts, or one shared pool for all dependencies. One slow dependency then takes everything down.
- Circuit breakers without fallbacks. Failing fast is good; failing fast with a useful answer is better.
- Health checks that depend on the overloaded resources. Liveness checks should be cheap; otherwise restarts make overload worse.
- Unbounded in-memory queues. They turn overload into out-of-memory crashes.
Quick Recap
- Latency explodes near full utilisation: simulated p99 was 93 ms at 50% load and 5.9 s at 99%. Keep headroom.
- Retries under overload create metastable failure: in the simulation, immediate and jittered retries never recovered from a 5-second dip.
- A retry budget recovered in 12 seconds; dropping expired requests on the server recovered instantly and served 47,954 of 48,000 requests.
- Slowness cascades up through waiting threads. Timeouts, bulkheads, circuit breakers with fallbacks, load shedding and backpressure each break the chain.
- Test resilience deliberately before an incident tests it for you.
Next lesson, the last one: seeing what’s happening across many services with logs, metrics and traces, and a capstone that applies the whole course to one system.